

Welcome back to the Electoral Math series, where we try to predict the outcome of the presidential race using the smartest metric: Electoral Votes (EV) charted over time. The first of this year's column series ran two weeks ago, and we've seen a lot of polling data since. A whopping 14 states moved around within the categories, but this much volatility is normal this early in the process.
Almost all of this movement was good news for Hillary Clinton, as states firmed up for her or even switched from Donald Trump's column over to hers. Clinton only saw bad news in one state, and Trump only saw good news in two states.
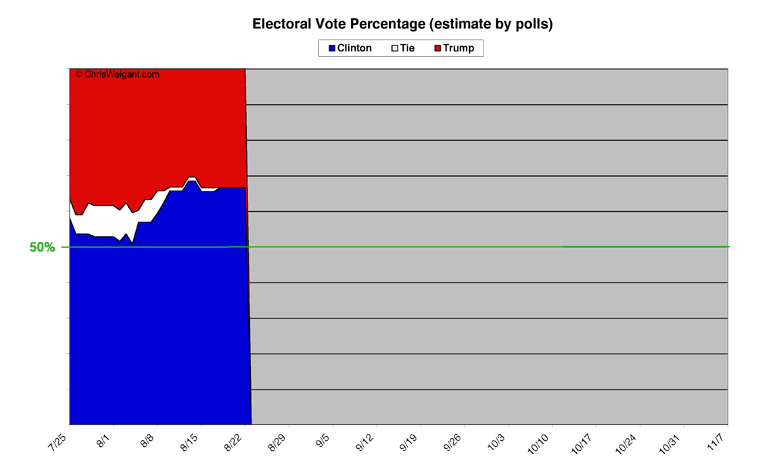
As always, we begin with an overview of how the election would turn out if it were held today (and if all the current polling is correct). As you can see, Clinton has considerably widened the lead she held two weeks ago. To read the chart, blue is Clinton and starts from the bottom; red is Trump and starts from the top. White are states which are tied, in the middle. Whichever color crosses the 50 percent line (from either direction) wins.
[Click on any of theses images to see larger-scale versions.]
As you can see, it's not even close. Hillary Clinton wins with a landslide of votes in the Electoral College. Clinton's percent of the total is 66.5, roughly twice Trump's 33.5 percent. Currently, no states are tied.
In fact, Hillary Clinton is now doing better than Barack Obama did for the entire 2012 election. Obama did hit the highs Clinton is now enjoying back in 2008, but not until a few weeks before the election (after the economy tanked and John McCain stumbled on what to do about it).
Two states wobbled a bit, but ended up roughly where they started. Texas was briefly stronger for Trump, then slipped back. Georgia cycled from being tied to Clinton then back to Trump, but not by a lot. Three states (Oklahoma, South Carolina, Missouri) weakened for Trump, with South Carolina weakening the most. Two states (Indiana and Utah) did firm up considerably for Trump. New Mexico weakened for Clinton, but this was due to the first poll becoming available (meaning the previous rating wasn't really all that valid). But Clinton saw six states get markedly better for her: Colorado, Florida, Iowa, Maine, North Carolina, and Ohio.
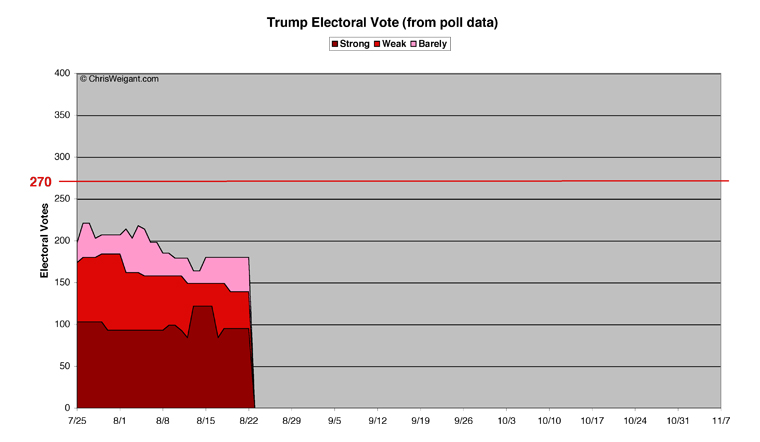
Let's take a look at how all this played out in the detailed charts for each candidate, starting with Trump. All raw data (and the category names) come from Electoral-Vote.com
[Definition of terms: "Strong" means 10 percent or better in the polls,
"Weak" means five percent or better, and "Barely" is under five percent.]
To put it bluntly, that's a pretty weak chart. Two weeks ago, Donald Trump had 93 EV in the strong category. Now he has 95. In the intervening period, Utah went from Weak Trump to Strong Trump, but Kansas slipped from Strong Trump to Weak right afterwards. South Carolina had been in the Strong column for Trump, based on their 2012 vote, but polling finally appeared for 2016 and it slipped all the way to Barely Trump as a result. Strong Trump did see a big surge when Texas moved up from Weak Trump, but then another poll a few days later meant it slipped right back again. During these four days, Trump hit his all-time high of 122 EV in the Strong category. Just after Texas fell back, Indiana was added to Strong Trump, leaving him where he is now, at 95 EV.
While Trump did swap a few states back and forth between Weak and Strong, the best indicator of any candidate's overall strength is tracking the "Strong Plus Weak" line, because it shows how many states they can feel fairly confident about. Trump lost two states from either Strong or Weak down to Barely Trump in the past two weeks, as South Carolina moved down and then Missouri followed suit. Both had initially been in the Strong Trump column, it's worth mentioning. Overall, Trump's Strong Plus Weak metric fell from 158 EV down to a new low for him at 139 EV.
When you add in the Weak Trump states, Trump's overall total has stayed fairly stable. He began two weeks ago with 185 EV and now holds 180 EV. He lost two states to Clinton (North Carolina and Iowa), but he gained Georgia, resulting in a loss of only 5 EV overall.
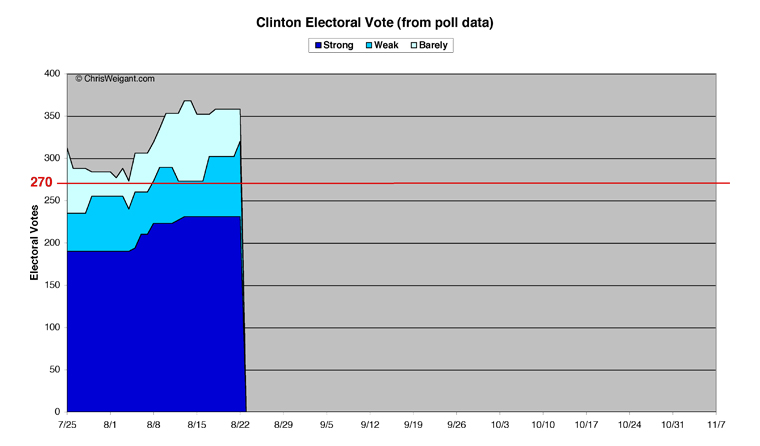
Now let's take a look at Clinton's chart.
This is, obviously, a much happier chart than Trump's. Two weeks ago, Clinton had just begun a big march upwards. She has continued this climb and now sits in a pretty enviable position. If the election were held today, it wouldn't even be close.
Most of the improvement to the Strong Clinton category happened just before I wrote my initial column two weeks ago. Clinton had hit 223 EV just in Strong alone at that point. Since then, she added Maine's 4 EV, and then New Mexico and Colorado swapped places (Colorado went from Weak Clinton to Strong Clinton while New Mexico did the opposite), which resulted in a net pickup of another 4 EV in the Strong category. Clinton ended the period with 231 EV in Strong -- only 39 EV short of victory in this category alone.
Clinton's Strong Plus Weak line bounced around a bit more, but climbed noticeably at the very end. Two weeks ago, Georgia moved from being tied all the way up to Weak Clinton, but then fell back to Barely Clinton and eventually switched over to Barely Trump. But the big news for Clinton in the Weak category was the addition of first Florida and then (just today) Ohio. Clinton's Strong Plus Weak started at 273 EV, moved up to 302 EV when Florida firmed up and just today hit a whopping 320 EV with the addition of Ohio.
Some context for that number is necessary. Barack Obama's highest total within Strong Plus Weak in 2012 was only 288 EV. He did better back in 2008, but only in the final few weeks of the campaign, when he hit 317 EV. To put this another way, even at his highest point during the excitement of the 2008 campaign, Obama never managed to hit the Strong Plus Weak number that Hillary Clinton just charted. Her current Strong Plus Weak 320 EV is fifty more votes than she needs to win the race, folks.
Clinton's overall total (with the Barely states added in) is even more impressive. Two weeks ago, Clinton had 319 EV overall. She now has 358 -- a full 88 EV more than she needs to win. Of course, things change over time and she may not be able to sustain this enormous advantage, but the fact that she's at such a strong point this far out is indeed notable.
My Picks
Of course, one poll number isn't always definitive. This is where some interpretation of the data comes in handy. That's a fancy way of saying that gut feelings also have their place when taking an overview of the race.
In my first column, I played things fairly conservatively, mostly due to the lack of data. This time around I'm getting a little more confident, but some states still remain a little questionable for me. As always, if you scroll down to the bottom of this column you can see the full lists of all the states in each of my categories, together with their Electoral Votes.
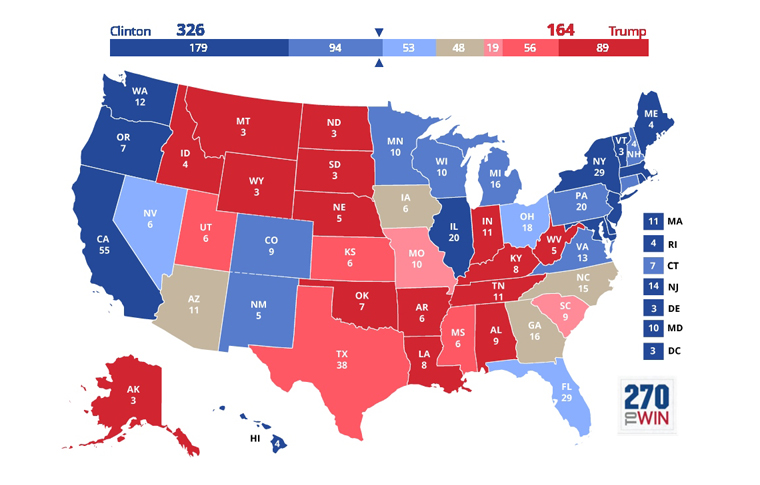
Here is my new map, broken down into my own categories of: Safe, Probable, Lean, and Too Close To Call. The darker the color on the map, the better for each candidate (and a big hat tip to 270toWin for both providing our map and also for pointing out last time around that I could create such seven-color maps on their site -- thanks, guys!).
Likely States -- Clinton
Safe Clinton (14 states, 179 EV)
Likely States are made up of Safe and Probable. The Safe column grew from last time by one state, as I moved Oregon up from Probable Clinton (not entirely sure why I put it so low to begin with, I have to admit). The rest of this deep-blue list remains the same this week.
Probable Clinton (9 states, 94 EV)
The Probable Clinton category had a flurry of movement, however. Oregon moved out of here (up to Safe), as I just noted. Four states (Colorado, Connecticut, Minnesota, and New Mexico) remained the same as last time around. But five states moved up to this category -- four from Leans Clinton (Michigan, New Hampshire, Pennsylvania, and Wisconsin) and Virginia moved all the way up from Too Close To Call, with several strong polls showing Clinton has opened up a double-digit lead there (Clinton is so confident in Virginia that she's pulled her advertising money out of the state, in fact).
Likely States -- Trump
Safe Trump (15 states, 89 EV)
Safe Trump saw three changes from last time. Indiana moved up to Safe from Probable Trump, but two states also moved down from this category for Trump. Kansas moved down to Probable Trump after a weak poll there, but the big news was the loss of South Carolina -- all the way down to Leans Trump.
Probable Trump (4 states, 56 EV)
There was good news and bad for Trump in the Probable category. Two states moved out, and two states moved in to replace them. Indiana was the best news for Trump, moving up to Safe. Utah moved up into Probable from Leans Trump, with a strong poll result there. That's the good news. The bad news for Trump was seeing Kansas slip down to Probable, and the loss of Missouri down to Leans Trump. Mississippi and Texas saw no changes and remain only Probable Trump at this point.
Tossup States
Leans Clinton (3 states, 53 EV)
Clinton saw a lot of movement both into and out of this category, and all of it was good news for her. While Nevada stayed in this category from last time, the other four states previously here all moved up to Probable Clinton. But the really big news was that both Florida and Ohio can now be considered Leans Clinton. Some might disagree (and call me too optimistic), so we'll just have to see what the next round of polling shows, but for now both states are showing a clear trajectory -- they've both moved from being tied to being Barely Clinton and then finally Weak Clinton. This means she's currently got margins of better than five points in each state, meaning they can't be considered true tossups any more. Of course, both of these states are historically very volatile, so things could change very quickly, but for now their big EV hauls have to be chalked up in Clinton's column.
Leans Trump (2 states, 19 EV)
This category has completely changed for Trump, as the one state that was here previously (Utah) firmed up for Trump, while two others (Missouri and South Carolina) weakened so much they can now only be seen as Leans Trump.
Too Close To Call (4 states, 48 EV)
The real tossup category is fairly small this week, considering how far out we are from the election. Three states moved out of Too Close To Call this time around, all of them in Clinton's favor. Florida and Ohio are now in Leans Clinton, and Virginia moved all the way up to Probable Clinton. This leaves only Arizona, Georgia, Iowa, and North Carolina. What's really eye-opening about that list is how dramatically it has shifted since the past few election cycles. Iowa is almost always a close state at some point in the race, but the other three used to be solid Republican states. Time will tell if this is due to the candidate the Republicans chose this time around or whether it represents a deeper demographic shift in the electorate. My off-the-cuff guess is that Arizona is probably weak because of Donald Trump, but that Georgia and North Carolina will continue to be seen as swing states in the next few presidential elections as well.
Final Tally
The past two weeks have been pretty consistently bad for Donald Trump and pretty consistently good for Hillary Clinton. This has been reflected in the state-level polling. Trump is seeing states weaken that he can't afford to lose (Missouri, South Carolina), and he's seen states that are also must-win for him move into Hillary Clinton's column (Florida and Ohio are merely the most prominent -- there are many others as well). Any possible pathway for Trump to win the necessary 270 EV is now almost impossible to see, given the current polling.
Donald Trump has 19 states firmly in his corner right now. That may sound impressive, at least until you consider that only three of them have 10 or more EV (and Tennessee and Indiana only have 11 EV each). The only big prize that Trump can count on is Texas, with its whopping 38 EV. Other than that, Trump is winning a lot of very rural states without a lot of population, which only gives him a total of 145 EV that he can currently count on. This leaves him an enormous 125 EV to make up if he has any prayer of winning. Trump only has two states even leaning his direction right now, and Missouri and South Carolina only have 19 EV between them. Even if you add in all the Leans Trump and Too Close To Call states, Trump only comes up with a grand total of 212 EV. That is 58 EV short of the goal.
Hillary Clinton has built on her enormous advantage this week. Last time around she had 18 states with a combined 210 EV in her pocket. This time around, Clinton has 23 states she can count on, and they add up to 273 EV. This is three more than she needs to win. Right now, Clinton could lose every current tossup state (even the ones leaning her direction), and she'd still win the election. To put this another way, Clinton doesn't even need the following states to claim victory: Arizona, Florida, Georgia, Iowa, Nevada, North Carolina, and Ohio. Trump could run the table in all these battlegrounds, and she'd still win. If you add in the three states leaning her direction, Clinton now has 326 EV. Trump's number, by comparison, is 164 EV. She's currently beating him by 162 EV -- meaning her total is almost exactly double Trump's total.
If this keeps up, there's not going to be a whole lot of "boy, this election is close, folks" news stories written over the next few months. To do so would be almost laughable when the margin is that huge. Rather than wondering who is going to win this election, the only question the pundits will have left to predict is how big Clinton's Electoral College landslide will be on Election Day. That is still months away, but Hillary Clinton is now in a safer spot than Barack Obama enjoyed at any time during either of his two elections.
[Electoral Vote Data:]
(State electoral votes are in parenthesis following each state's name. Washington D.C. is counted as a state, for a total of 51.)
Hillary Clinton Likely Easy Wins -- 23 States -- 273 Electoral Votes:
Safe States -- 14 States -- 179 Electoral Votes
California (55), Delaware (3), Hawaii (4), Illinois (20), Maine (4), Maryland (10), Massachusetts (11), New Jersey (14), New York (29), Oregon (7), Rhode Island (4), Vermont (3), Washington (12), Washington D.C. (3)
Probable States -- 9 States -- 94 Electoral Votes
Colorado (9), Connecticut (7), Michigan (16), Minnesota (10), New Hampshire (4), New Mexico (5), Pennsylvania (20), Virginia (13), Wisconsin (10)
Donald Trump Likely Easy Wins -- 19 States -- 145 Electoral Votes:
Safe States -- 15 States -- 89 Electoral Votes
Alabama (9), Alaska (3), Arkansas (6), Idaho (4), Indiana (11), Kentucky (8), Louisiana (8), Montana (3), Nebraska (5), North Dakota (3), Oklahoma (7), South Dakota (3), Tennessee (11), West Virginia (5), Wyoming (3)
Probable States -- 4 States -- 56 Electoral Votes
Kansas (6), Mississippi (6), Texas (38), Utah (6)
Tossup States -- 9 States -- 120 Electoral Votes:
Tossup States Leaning Clinton -- 3 States -- 53 Electoral Votes
Florida (29), Nevada (6), Ohio (18),
Tossup States Leaning Trump -- 2 States -- 19 Electoral Votes
Missouri (10), South Carolina (9)
Too Close To Call -- 4 States -- 48 Electoral Votes
Arizona (11), Georgia (16), Iowa (6), North Carolina (15)
Polling data gaps:
Polled, but no polling data since the primaries -- 6 States
(States which have not been polled since the beginning of June, with the dates of their last poll in parenthesis.)
Louisiana (5/6), Maryland (4/17), Massachusetts (5/5), Minnesota (4/27), Mississippi (3/30), New Mexico (5/15)
No polling data at all, yet -- 12 States
(States which have not been polled so far this year.)
Alaska, Alabama, Hawaii, Kentucky, Montana, Nebraska, North Dakota, Rhode Island, South Dakota, Washington D.C., West Virginia, Wyoming
Chris Weigant blogs at:
Follow Chris on Twitter: @ChrisWeigant