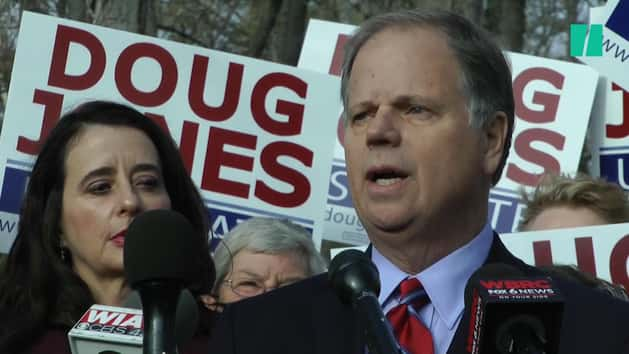
Even before Democrats’ victory in last week’s Alabama Senate election, there were signs that Republicans may be in trouble in the year ahead. Democrats overperformed in dozens of other special elections this year. Their generic ballot numbers are remarkably strong. And while it’s early in the election cycle, some polling gives the party a distinct advantage in enthusiasm ahead of next year’s congressional midterms.
Democrat Doug Jones’ win in Alabama, the culmination of an atypical race, was just the latest evidence of the potential for a blue wave of voters to show up in 2018, pollsters say. And it’s already affecting how they’re trying to figure out who will turn out next November.
“What fascinated me is, as bizarre as this was, the things that we made assumptions about based on [the outcomes] in Virginia and Georgia and South Carolina did play out in Alabama in the same way,” Patrick Murray, Monmouth University’s polling director, told HuffPost. “I think we’re seeing a pattern form.”
Normally, Murray said he’d set a high bar when trying to determine who’s likely to vote in a midterm election, screening out most people who don’t have a history of voting regularly. But next year, that may not be the right approach.
“We are getting voters who are either new voters or have only voted in presidential elections who are coming out in these special elections or midterms,” Murray said. “That changes the model significantly.”
Others in the field are drawing similar conclusions. Jones won in part by turning out “people who have never come out in a midterm or special election,” John Anzalone, a Democratic pollster based in Alabama, told CNN, describing those voters as “disproportionately our people.” Democrats, noted Chris Jackson of the polling firm Ipsos, voted last week as if the Alabama Senate race was a presidential election. Republicans voted as though it were a midterm. That fact will be among the data Ipsos will take into consideration next year.
SurveyMonkey’s polls in Alabama, as well as earlier gubernatorial races in New Jersey and Virginia, “provided advance warning that voter turnout would benefit the Democrats more than usual,” according to a blog post by Mark Blumenthal, the online firm’s head of election polling and a former HuffPost editor.
“This pattern is unusual, since Republican voters are more likely to be older and white, subgroups that typically turn out a higher levels and report greater intent to vote,” Blumenthal wrote. “Not so in 2017.”
Figuring out who’ll actually turn out to vote is a perennial challenge for pollsters. That was especially true in Alabama’s election last week, where the uncertainty led several public pollsters to take the somewhat-unusual step of issuing multiple models of how the race might end, depending on turnout and other factors. Now, those pollsters are going back through their data to shed light on the best ways of identifying likely voters in next year’s election.
Monmouth, for instance, released three turnout models of the race: a 4-point lead for Republican Roy Moore when using a “historical midterm model, akin to Alabama’s 2014 turnout,” a dead heat using a model with “relatively higher turnout in Democratic strongholds,” and a 3-point edge for Democrat Doug Jones when using a “model with higher overall turnout, where voter demographics look more like the 2016 election.” Jones’ 1.5-point margin of victory fell squarely between the latter two.
SurveyMonkey offered 10 outlooks on the race, based on different turnout assumptions and weighting methods. Narrowing the race to voters who said they’d shown up for the 2014 midterms (or were age 18 to 20 and said they were certain to vote), and weighting the results to match the outcome of last year’s presidential race gave Moore a 10-point advantage. Using voters’ assessments that they would probably or certainly show up and forgoing that weighting shifted the results to a 9-point lead for Jones.
Relying on respondents’ self-reported data about their likelihood to vote and looking at their behavior in the past each carry potential pitfalls. People aren’t always good at predicting whether they’ll vote, and questions designed act as proxies can backfire. In the run-up to 2012, for instance, questions geared to make sure voters were paying attention to the presidential race ended up screening out some voters who’d long ago decided they would support Barack Obama for re-election. Screening out those who’ve rarely or never voted in past years, of course, risks missing the infrequent voters who may be swept along to the ballot box as part of a wave.
SurveyMonkey found that its models based on self-reported voter intent proved more successful this year than self-reported past turnout in providing advance warning that Democratic voters would turn out at higher rates than Republicans.
That, Blumenthal wrote, “provides an important lesson for 2018.” But he cautioned that it won’t necessarily be the case for every election. Other takeaways ― such as whether it’s useful to weight results by who respondents voted for in 2016, along with more standard demographic weighting ― may also prove case-specific.
“From a polling methods perspective, [Alabama] was very much an outlier,” Blumenthal said. “The unusual uncertainty inherent in polling this particular election was definitely a factor in our decision to release 10 different estimates including eight distinct likely voter scenarios.”
Expect to see more of those scenarios next year. Pollsters who’ve offered multiple models hope they’ll provide a peek behind the curtain of how polls work, and a better sense of what to expect on Election Night. A 2016 post-mortem released by polling industry experts stressed the need to emphasize that uncertainty in horserace polling that can carry far beyond a survey’s margin of error.
“There’s people who just want to know what’s going to happen, and for them we produce our best-faith estimate,” Jackson said. “But for more general information, having these ranges captures that uncertainty better. It’s a little truer to the uncertainty seen in the data.”

