
That growing divide between the rich and you? It's not just in your mind, and it's certainly not just a couple years in the making.
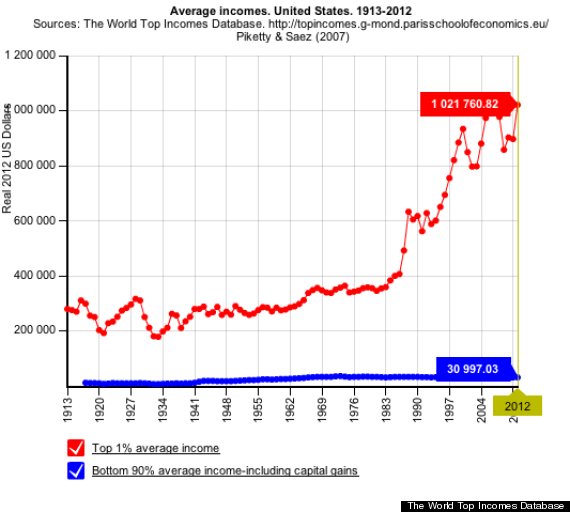
Actually, the average incomes of the top 1 percent of Americans have grown steadily over the last century or so, especially when compared to the flat-lining incomes for the bottom 90 percent of Americans. But as you can see in the above chart, it wasn't until the 1980s that the rich really started to pull away from the normals.
We created the chart using the World Income Database, a collection of data compiled by a group of economists who focus on the incomes of the rich, poor and middle-class. The chart plots the average income of the top 1 percent of American earners against the average income for the bottom 90 percent of Americans between 1913 and 2012, using real 2012 dollars.
In 2012, the top 1 percent took home more than $1 million on average, while the average income of the bottom 90 percent of Americans was $30,438. Compare that to 1917, when the top 1 percent's average income was just under $300,000 and the bottom 90 percent took home slightly more than $11,000 on average.
So how is it that the U.S. income gap has grown large enough for us to claim the title of worst inequality in the developed world? There are a variety of explanations:
1. Tax Cuts For The Rich: Many of the spikes in the chart correspond with periods when the government slashed taxes on the rich. As the Center for American Progress notes, Ronald Reagan’s early 1980s tax reforms helped to increase income inequality.
The same thing happened in the late 1990s when Bill Clinton passed a tax cut on capital gains, or investment income, which rich people are more likely to have than ordinary Americans. And then it happened again when George W. Bush cut the top marginal tax rates in 2001 and 2003.
Altogether, about 30 percent of the expansion of the after-tax income gap between 1979 and 2007 was due to tax and budget policies becoming less progressive, according to a June analysis from the Economic Policy Institute.
2. Corporate Profits And Executive Pay Are Soaring: Over the past several years corporate profits -- which go in large part to rich investors -- have soared to the point where they now make up the highest share of the economy on record. And over the last several decades, CEO pay also skyrocketed. The result: The ratio between CEO and average worker pay ballooned by roughly 1,000 percent since 1950.
3. The Wages Of Regular Workers Haven't Kept Up With Productivity: In the 1960s workers and their families used to be able to live above the poverty line on a minimum wage income. But now, that’s no longer the case, according to EPI. In fact, if the minimum wage had kept up with boosts in worker productivity over the past several decades it would be $18.30, according to EPI. That's more than double the current minimum wage of $7.25.
Part of the reason workers have had a tougher time securing higher wages in recent years is because of a marked decline in unionization. Drops in union membership typically correspond with growth in income inequality, research finds.
Related
Before You Go
