Apple chooses margin over volume as iPhone and iPad mixes drive higher prices
Consumer Intelligence Research Partners released analysis of product pricing of Apple, Inc. (NASDAQ:AAPL). This analysis indicates that in the most recent quarter Apple increased its average selling price (ASP) in the US, after several quarters in which it generally declined.
CIRP used its survey data to compile a simple distribution of sales at each retail price point. The cumulative price curve shows the percentage of units sold at or below each price. As the price curve moves to the right, ASP increases.
For iPhone, the price curve has remained somewhat stable in the past two years (see chart). Through 2012, the price curve moved left, reflecting a lower average selling price. During 2013, the curved moved right, as average selling price increased.
iPhone Price Curve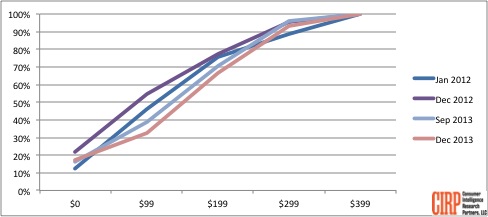
The iPad price curve has been somewhat less stable than the iPhone price curve (see chart). After starting 2012 with the highest pricing in the past two years, the curve moved quickly far left, after introduction of the low-priced iPad mini. It recovered strongly in the most recent quarter, after Apple introduced higher priced iPad Air and iPad mini with Retina display models.
iPad Price Curve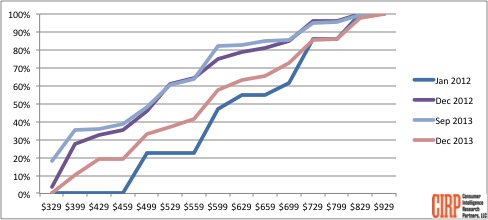
For both iPhones and iPads, Apple's newest product lines have succeeded in pushing higher priced models and presumably higher margins. While in recent years both lines have been expanded to include closer to entry-level priced models, the moves in 2013 seemed a successful attempt to emphasize margin over volume.
As a single number, ASP hides some interesting elements of product pricing. The curve expands ASP, and shows how much Apple sells at each price point. What's useful is, it's independent of specific iPhone or iPad model, so we don't get distracted by whether customers like the iPhone 16GB 5S or 32GB 5C, since they're the same price.
CIRP bases its findings on its survey of 500 US buyers of Apple products from October-December 2013 in January 2014.
For additional information, please contact CIRP.