by Taeku Lee, Ph.D.
With the debates now in the rear view mirror and less than three weeks ahead before Election Tuesday, Asian American Decisions is excited to report out some fresh new results on where Asian Americans stand on this election. Media coverage of this long, rancorous, and at times closely contested election has been flooded with polling data that painstakingly and recurrently monitor small shifts in the expected vote among key demographic groups and in battleground states. Yet, until recently, there has been little coverage of one potentially pivotal group of voters among whom relatively little is known: Asian Americans.
Why Pivotal?
The case for Asian American voters to potential be the "margin of victory" in an election has been made before, but it is worth reviewing the basic elements of the case. First, Asian Americans are not only the nation's fastest growing racial group (growing 43 percent between 2000 and 2010, for example), but they are also the fastest growing racial group among voters (adding an estimated 500,000 to 600,000 new voters in each of the last few presidential elections). Today, Asian Americans are not only a significant force in numbers in states like Hawaii, California, Washington, New Jersey, and New York, but they are also growing at astonishing rates in "new destinations" for immigration through the American South, Midwest, and Southwest.
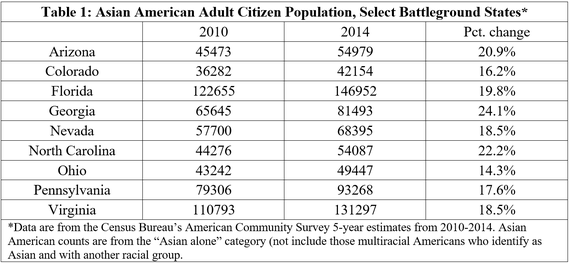
The rubber of this growth in numbers hits the road to electoral victory in key battleground states. In Arizona, Florida, Georgia, Nevada, North Carolina, Pennsylvania, and Virginia, the Asian American population has grown by more than 80 percent since 2010, outpacing the overall population growth rates for the U.S. Asian American population. In Virginia, Asian Americans are now 8 percent of the state population; in Nevada, they are almost at 11 percent. As Table 1 below shows, the Asian American voter eligible population is substantial and rapidly growing across many key battlegrounds. As of 2014, in states like Florida, Pennsylvania, and Virginia they approach or exceed 100,000 in number.
Vote Choice in 2016
In the last few weeks, some data on where Asian American voter stand in the 2016 election are finally emerging. Earlier this month, I worked with colleagues to release preliminary findings from the 2016 National Asian American Survey, a telephone survey fielded between August 10 and September 29. The findings showed that Asian Americans appear poised to vote for Democratic candidates once again in overwhelming numbers.
This week, Asian American Decisions updates these data with the results of a more recent online poll of registered voters fielded between September 29 and October 11, dates that are inclusive of the second presidential debate and the "Access Hollywood" videotape release on Donald Trump. On the top of the ticket, 63 percent of Asian Americans support Clinton, 17 percent Trump, 9 percent picked someone else, and 12 percent declined to state who they will support. The two-way split between Clinton and Trump is 78 percent to 22 percent. If the final tally approximates these figures, the Democratic vote share of Asian Americans will exceed their previous high water mark in 2012, continuing the steady upward trend in Democratic voting since 1992.
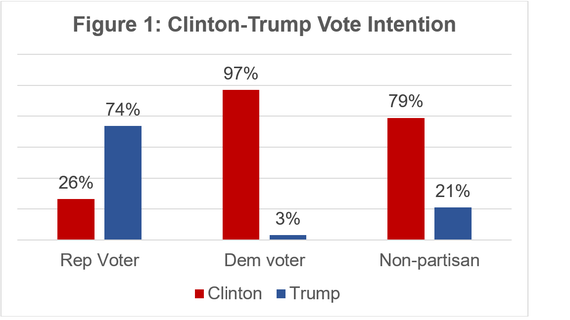
 Moreover, Figure 1 above shows the same two-way split by party identification. While party voting remains salient, the difference between Asian Americans who identify as Republicans and Democrats is striking. Nearly 1-in-4 Republican identifiers report that they will cross party lines and support the Democratic nominee, Hillary Clinton. On the other side of the aisle, a nearly negligible 3 percent of Democratic identifiers indicate that they plan to vote for Donald Trump. The results also show overwhelming support for Clinton over Trump among non-partisans who intend to vote, with Clinton enjoying a nearly 4-to-1 margin.
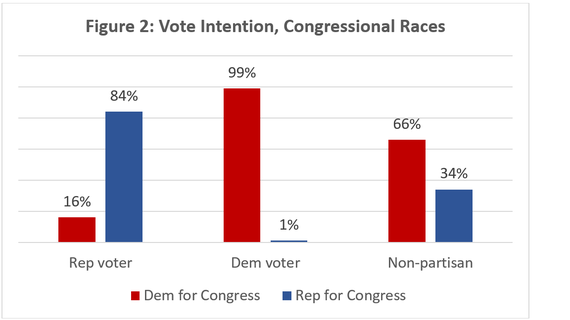
As Figure 2 shows, this rather one-sided support for Democratic Party candidates continues down-ballot. In Congressional races, 59 percent of Asian Americans would vote for Democratic candidates, 21 percent Republican candidates, with the remaining 20 percent who either did not know or declined to state their vote intention. The two-way partisan split for Congressional races is 74 percent to 26 percent.
 As with the presidential race, partisanship helps to sort how Asian Americans intend to vote in Congressional races. Here, expected cross-over voting among Asian Americans who identify as Republicans remains much higher than for self-identified Democrats, but the magnitude of this cross-over voting is somewhat less than in the presidential race. Nearly 1-in-6 self-identified Republicans plan to mark their ballots for a Democratic congressional candidate; less than 1 percent (!) of self-identified Democrats plan to cross party allegiances and vote for a Republican candidate. Non-partisan Asian Americans also heavily favored Democratic candidates, by a 2-to-1 margin.
Voter Mobilization
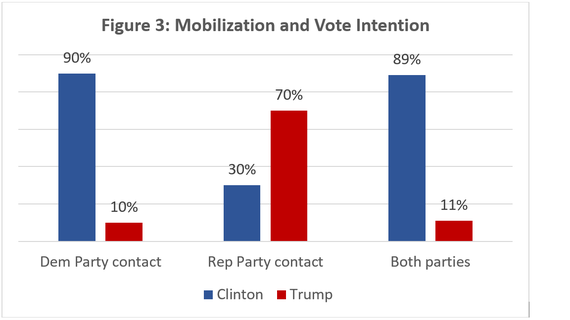
One of the keys to any election is voter mobilization. Given the remarkably high negative favorability ratings voters have given to both party candidates, turnout is likely to be even more important in 2016. Respondents in the Asian American Decisions poll were asked, "Over the past few months, did anyone from the Democrat or Republican party call you or come by your home to talk about this year's election?" The findings show that, even into the waning weeks of the election, only a small fraction of Asian Americans are targeted for their votes: 22 percent indicated that they had received a call or a knock on their door. Of those, 47 percent were contacted by the Democratic Party, 14 percent by the Republican Party, and 39 percent by both.
 The difference that contact makes shows both the potential for Democrats in 2016 to further consolidate their recent gains among Asian American voters and the uphill climb that the Republican Party faces. As Figure 3 above indicates, nearly 90 percent of Asian American registered voters who were contacted solely by the Democratic Party intended to vote for Clinton, while only 70 percent of those contacted solely by the Republican Party intended to vote for Trump; among those contacted by both parties, 89 percent percent intended to vote for Clinton. In the congressional races, this effect is even more pronounced, with 97 percent of those contacted by the Democratic Party reporting their intent to vote for Democratic congressional candidates. Preview
These findings on vote choice and voter mobilization are the first in a series of blog posts that will be forthcoming about the Asian American vote leading up to Election Day. Next week's post will delve more deeply into why Asian American voters appear to so heavily favor Democratic candidates again in 2016. These results, furthermore, are a preview of a major Election Eve poll of Asian American voters that Asian American Decisions will be conducting in partnership with Asian American and Pacific Islander Civic Engagement Fund and several other co-sponsoring organizations. The Election Eve poll, is part of a series of surveys conducted of Asian American voters in the days prior to Election Day, conducted in parallel with the Latino Decisions Election Eve polls. The 2016 Eve poll will include a nationally representative sample of Asian American voters as well as oversamples in seven additional states: Florida, Illinois, Nevada, North Carolina, Pennsylvania, Texas, and Virginia.
Taeku Lee is managing director of Asian American Decisions and Professor of Political Science and Professor of Law at the University of California, Berkeley.
Survey Details: This poll surveyed 300 Asian American registered voters who were randomly recruited from a list of registered voters to complete an online survey. The sample was restricted to the six primary Asian American groups, comprising 85% of the total U.S. Asian American population: Chinese, Filipinos, Asian Indians, Japanese, Koreans, and Vietnamese. Interviews dates were September 29 and October 13, 2016. The questionnaire was offered in English, Chinese, Korean, Tagalog, and Vietnamese. 24 percent of the sample took the interview in a non-English language. The margin of error for the results is +/-6 percent.

