
This is an especially bad time to be born into a low-income family, according to data from a new report.
In the report, University of New Hampshire Carsey School of Public Policy researchers assess the opportunities for social mobility for kids from low- and high-income families across all 50 states and in the District of Columbia. It is now harder for children born into poverty to move into higher socioeconomic classes than it was in the past -- although circumstances vary across the country, the report suggests.
"Social mobility has remained fairly stable for generations, but recent evidence across a range of indicia suggests growing gaps in the opportunities available to children in lower socioeconomic status families versus those in families of higher socioeconomic strata," says the report, released this week. "This pushes the American Dream--or the idea that anyone who works hard, and plays by the rules, can get ahead--further out of reach."
The report uses parental income and education level as a gauge of socioeconomic status. The UNH researchers released the report to coincide with the publication of Our Kids: The American Dream in Crisis, a book by Harvard University public policy professor Robert Putnam, although the two projects aren't affiliated with each other. In the book, Putnam argues that there is a dearth of informal and formal support systems available to low-income children. He is also the author of Bowling Alone: The Collapse and Revival of American Community, in which he looks at the unraveling of civic life in America.
The UNH researchers were interested in seeing how Putnam's idea -- that opportunities for impoverished children have decreased over time -- plays out by state, Beth Mattingly, director of research on vulnerable families at the Carsey School, told The Huffington Post.
"We see consistent disadvantage for youth of low socioeconomic status, and in general, growing divergence over time," Mattingly said. "This notion that everyone can make it over time doesn’t bear out."
The report has state-specific graphs that illustrate opportunity gaps between children from high- and low-income families, but does not provide analysis as to which states are doing particularly well in addressing this inequality.
State-level data "masks a lot of local variation," Mattingly said. "Data isn’t the best for seeing where there are places that are doing cool things and getting things right."
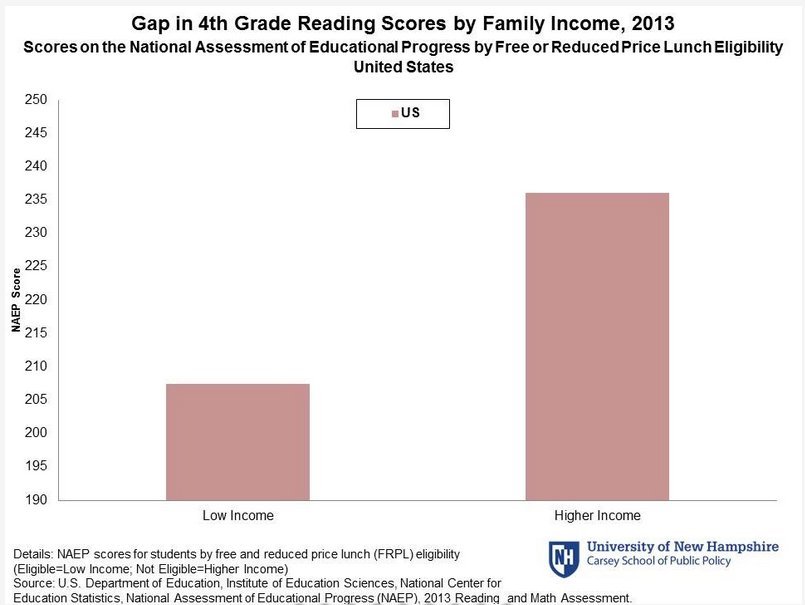
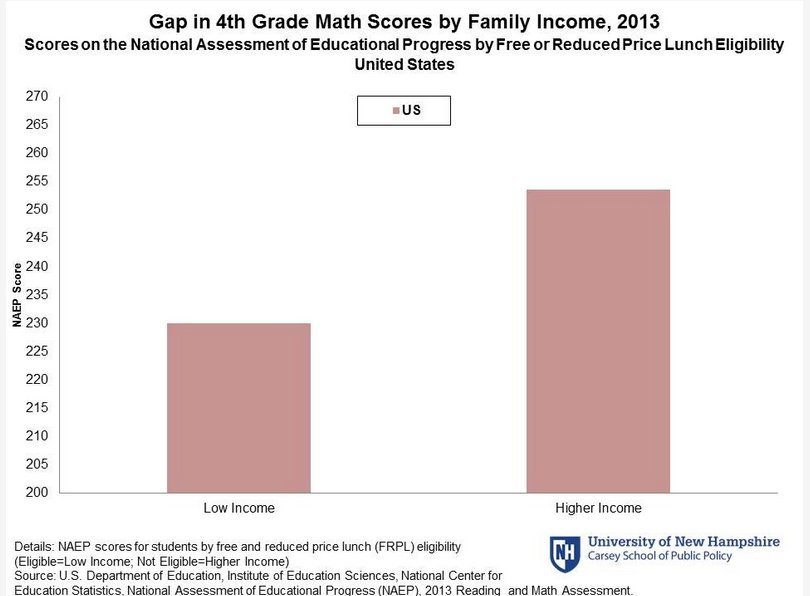
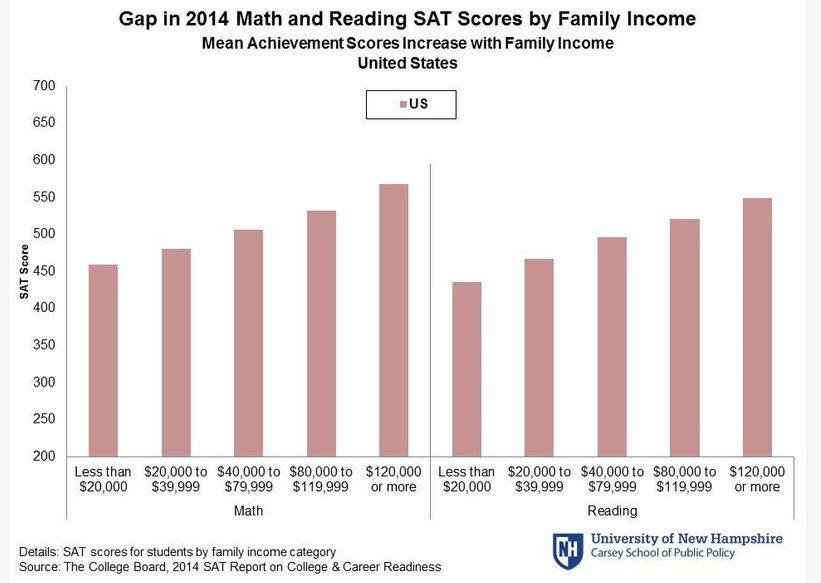
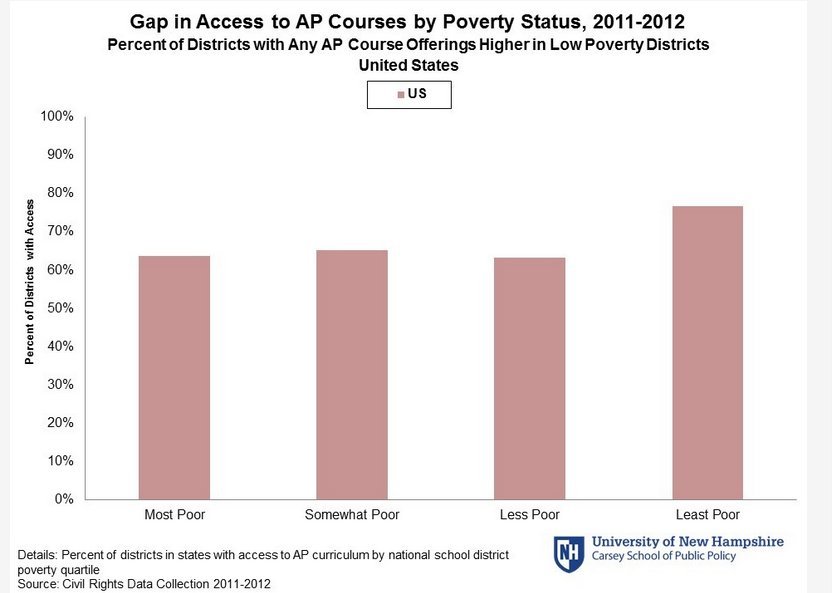
The education system can also play a role in widening the opportunity gap, Mattingly noted. "Poorer schools tend to have less access to advanced courses, although that’s a huge variation by state."
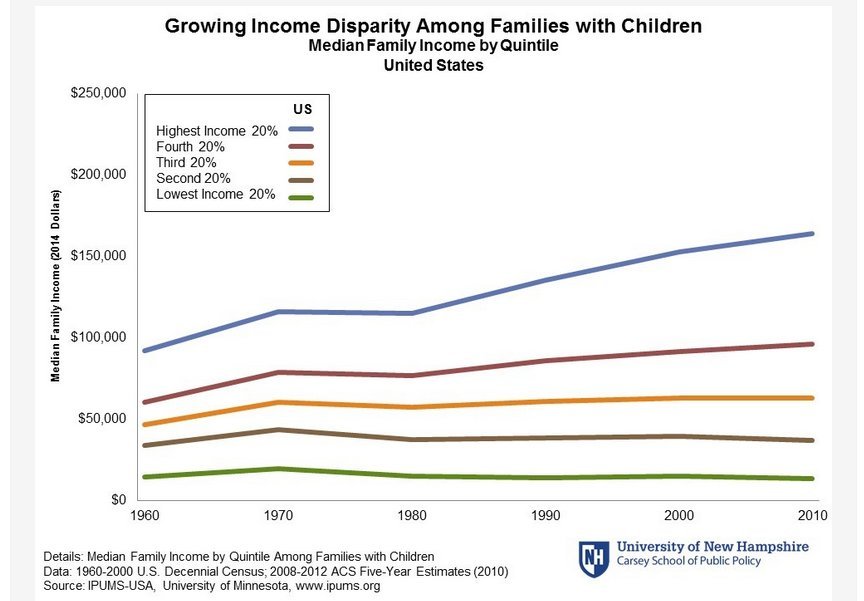
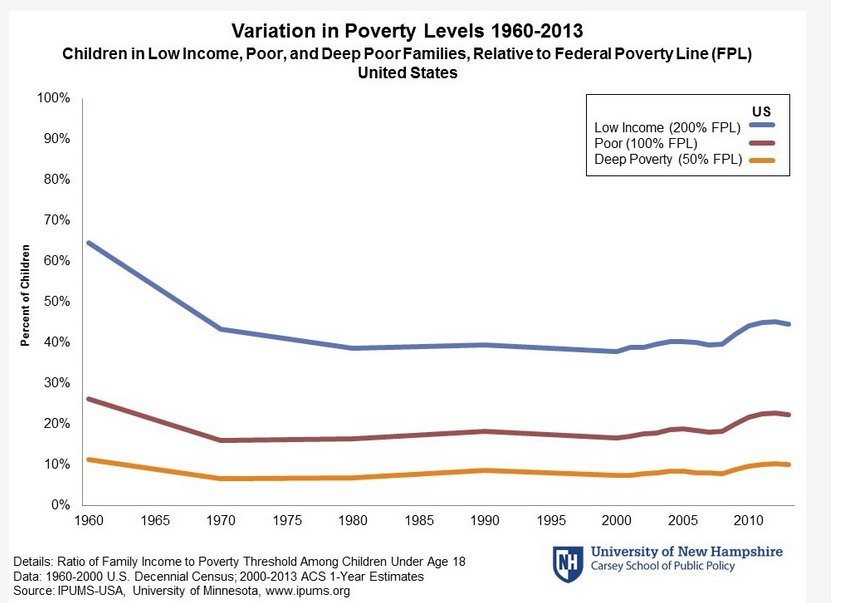
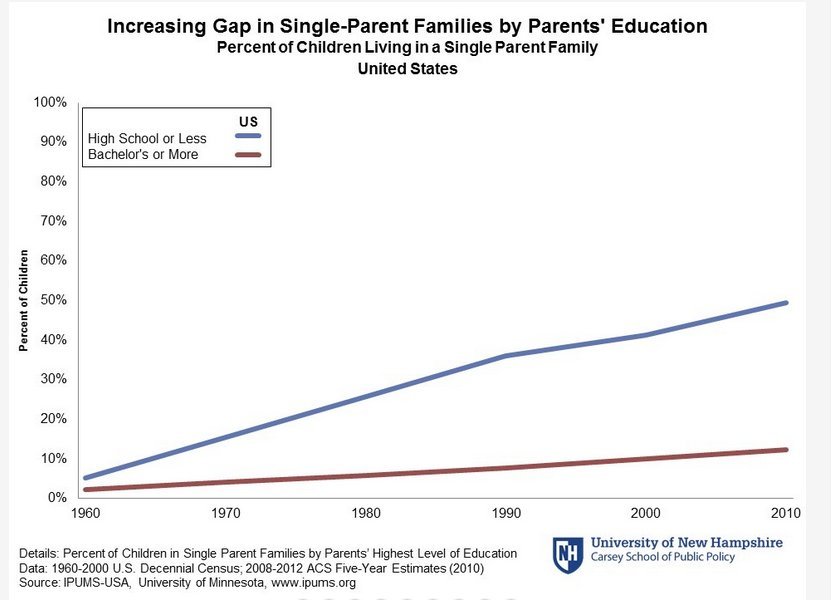
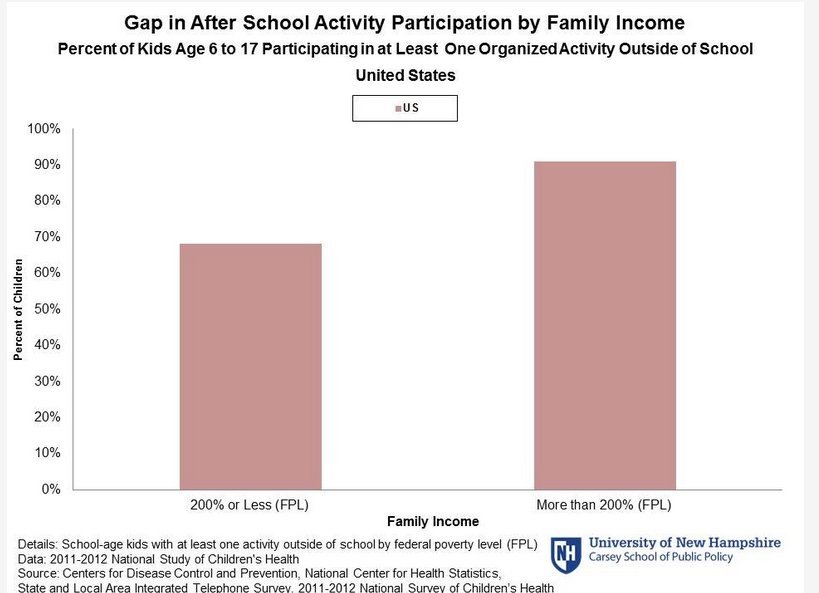
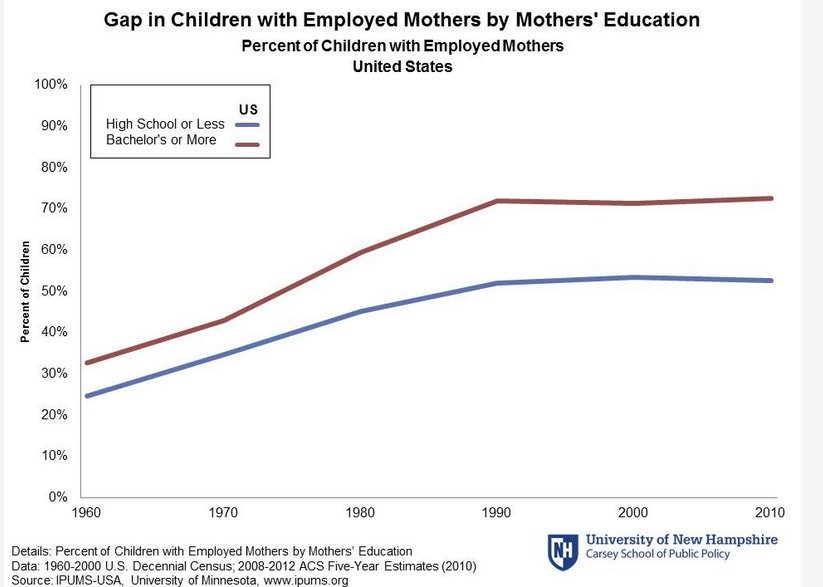
Below we have compiled nine graphs from the report that look at national data on these issues. They show the widening income gap for very rich and very poor families and how these gaps may contribute to differences in academic achievement.
1. 
2. 
3. 
4. 
5. 
6. 
7. 
8. 
9. 
Before You Go
