It has been reported that the Dow Jones Industrial Average (DJIA) last week reached a four year high not seen since before the onset of the financial crisis. Just one look at this graph shows that this is true, and that the DJIA is within striking distance of reaching its all time daily high of 14,164 which it hit on October 7, 2007.
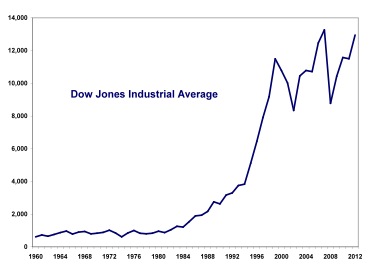
This chart seems to be saying that anyone who invested in the Dow during this 50 year run has much to celebrate, especially given the fact that this chart shows levels of the Dow and does not try to calculate holding period returns which would be even better once you include dividends paid each year. It also suggests that people who bought and held during the crisis were rewarded as the Dow rebounded from its crisis low of 6,627 on March 6, 2009. But does this graph tell the whole story?
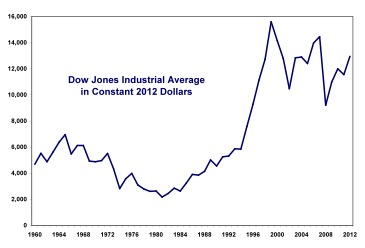
Here is the same graph of the DJIA, but now adjusted for historical consumer price inflation. Suddenly, the recent trend line is not so obvious.
I would argue that adjusting the DJIA solely for historical consumer price inflation does not tell the whole story. The Consumer Price Index, by definition, can only tell you about historical inflation. Other assets that can act as long stores of wealth move in price not only to reflect historical inflation, but investors' best estimate of future inflation as well. We see that these long maturity assets move up in nominal price reflecting expected future inflation long before consumer prices ever start to move up.
So, it only seems fair to compare the DJIA as a store of wealth to other long assets to see how it did in preserving its purchasing power relative to these assets. Maybe the Dow's recent run-up in nominal price is just reflecting greater expected inflation in the future similar to what is driving gold and other commodity prices higher.
Here is a picture that shows how the DJIA has done if priced in gold ounces instead of US dollars.
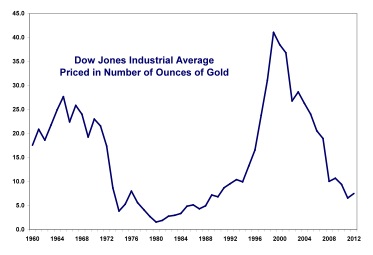
Where did the big rebound go from the crisis's depths in 2009? Where is this new high that everyone is talking about? And what has happened to our country's stock market wealth since 2000?
The problem with measuring the Dow in US dollars is that the dollar itself makes for a terrible yardstick. The dollar itself has lost 98% of its purchasing power relative to gold over the last fifty years as this chart shows.
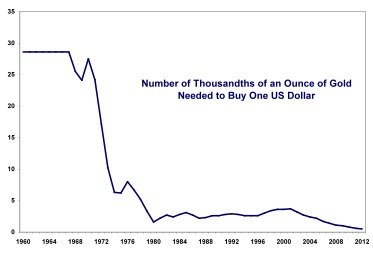
It isn't that gold has gone up in price; it is that the dollar is worth less because the Federal Reserve keeps printing more of them, mostly to bail out the banks from their bad loans. Measuring wealth or the Dow in dollars would be like measuring a rug for your home, and the yardstick you were using was changing in length each day and over fifty years was 98% shorter.
The purchasing power of gold has not changed much over the years. An ounce of gold could always buy a fine men's suit or approximately 15 to 20 barrels of oil. It is the dollar that is devaluing. Gold doesn't have any real productive uses so its only value is as a store of wealth. In one sense, this is good as its inherent value should not change that much during boom or bust times since it has so few productive uses. And much of the volatility you see in gold prices is due to the dollar's fluctuating value, not the inherent value of gold.
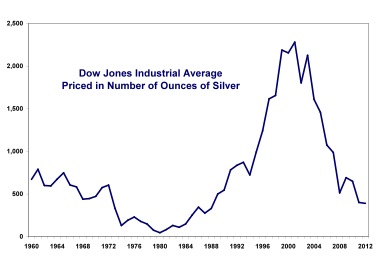
But, maybe I haven't convinced you that what we are seeing in the Dow is a US dollar problem. Maybe, you still think that it is the price of gold that is driving this analysis. Well, here is the same Dow priced in ounces of silver.
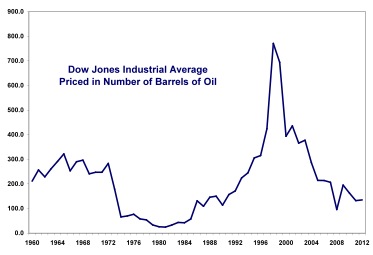
And here is the Dow priced in barrels of oil.
No matter how you cut and slice it, the Dow is not near its historical highs and any rebound you may have thought you had seen in US dollar terms is illusionary.
Of course, if you were going to ask how you really have done investing in the Dow over time, you need to do a holding period analysis and include an assumption that any dividends paid were reinvested in the Dow. Here is that analysis.
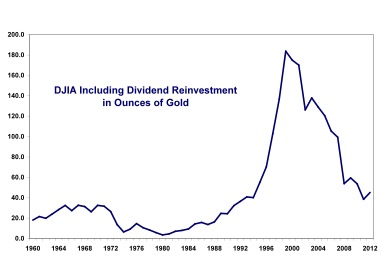
Again, this analysis prices the Dow returns in ounces of gold to get away from the deteriorating and highly fluctuating value of the dollar. And the story is not pretty. An investor has given back almost all his returns that he has earned over the period.
This analysis raises some very big questions. What has the US been doing the last fifty years to have such a disappointing real performance from its major stock market index? (An analysis using the S&P 500 index instead of the DJIA would show similar results). While 1980 brought good times for the stock market as Reagan deregulated and Volker slowed inflation and Clinton balanced the budget, how is it possible that we have given almost all of these gains back just since 2000?
That question is the subject of much more research. My guess, 1- The Federal Reserve and other countries' central banks printing enormous amounts of money and destabilizing their currencies has done much greater damage to the global economy than previously realized, 2- the banks, acting as our primary allocators of capital, have done a poor job picking winners and making good investments and their increasing leverage and loose lending terms seem to cause unsustainable booms and bubbles that eventually burst, 3- corruption is much more endemic in our financial and corporate worlds where more and more of the real cash flow coming off a business is rerouted to greedy managers and executives, their bankers, and hedge fund and private equity funds, 4- lobbying and corporate money in politics have resulted in public policy that is narrow and short-sighted and bad for growth in the long run, and 5- globalization and international trade has been much less a panacea than economists have made it out to be. Smaller emerging markets have indeed accelerated their growth, but this has come as the advanced countries of the world have seen their real annual growth rates in per capita GDP decline from 2.7% in the '70's to .7% per year in the 00's. When you think about it, not everyone can export their way to prosperity because increasing exports, by definition, is a zero sum game.
John R. Talbott, previously a Goldman Sachs investment banker, is a best selling author and economic consultant to families whose books predicted the economic crisis. You can read more about his books, the accuracy of his predictions and his financial consulting activities at www.stopthelying.com