Brace yourselves, East Coasters.
A new report finds that rates of sea level rise in a "hotspot" along the U.S. Atlantic Coast are increasing about three to four times more than the global average and could "increase the vulnerability of coastal cities to flooding, and beaches and wetlands to deterioration."
The report by U.S. Geological Survey (USGS) government scientists was published online Sunday in the journal Nature Climate Change.
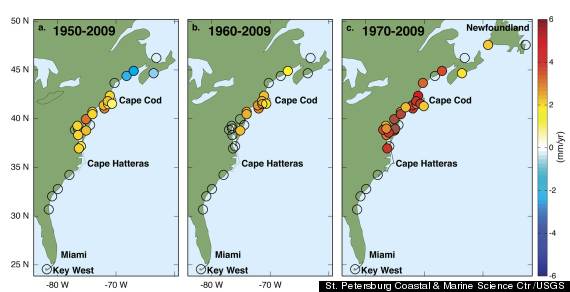
By studying tide gauge data, the scientists found that climate change-induced sea level rise is not uniform, but rather there are variations causing sea levels to rise faster in some regions, most notably along a 600-mile-long "hotspot" on the Atlantic Coast from Cape Hatteras, N.C. to north of Boston, Mass.
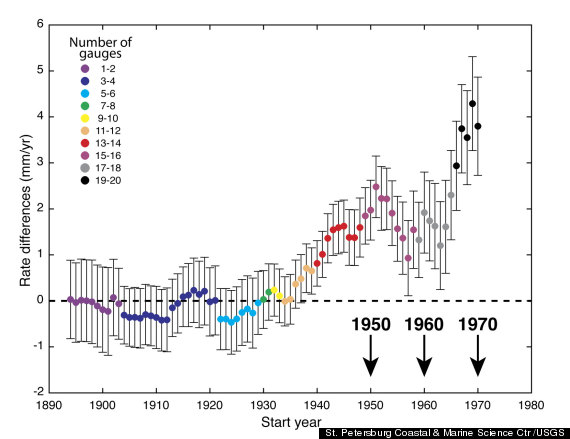
Increases in the rate of sea level rise in this region were higher than the global average between 1950–1979 and 1980–2009.
According to a USGS press release, sea level rise in the "hotspot" has increased 2 - 3.7 millimeters per year since about 1990, compared to the global increase of 0.6 – 1.0 millimeter per year. Assuming that temperatures will keep rising, the data suggests that rates of sea level rise in this region will keep increasing.
The scientists suggest the acceleration of sea level rise along the hotspot is consistent with a slowdown of Atlantic Ocean circulation. This circulation change could be associated with changes in the subpolar north Atlantic.
The Guardian explains that sea level rise acceleration could be due to the slowing of currents, which are "driven by cold dense water sinking in the Arctic, but the warming of the oceans and the flood of less dense freshwater into the Arctic from Greenland's melting glaciers means the water sinks less quickly. That means a 'slope' from the fastest-moving water in the mid-Atlantic down to the US east coast relaxes, pushing up sea level on the coast."
USGS Director Marcia McNutt pointed out in the press release, "Many people mistakenly think that the rate of sea level rise is the same everywhere as glaciers and ice caps melt, increasing the volume of ocean water, but other effects can be as large or larger than the so-called 'eustatic' rise." She added that the study shows "regional oceanographic contributions must be taken into account in planning for what happens to coastal property."
Global sea levels, which could rise more than three feet by the end of the 21st century, will climb at different rates in every location. "Differences in land movements, strength of ocean currents, water temperatures, and salinity can cause regional and local highs and lows in sea level," according to the USGS.
The study predicts that by 2100, the Atlantic coast "hotspot" will experience sea level increases of 8 to 11.4 inches, in addition to the global rise in sea levels.
The Boston Globe describes how Massachusetts has been preparing for sea level rise by inspecting utility systems, changing codes for development projects in flood zones and creating incentives not to build in vulnerable areas.
As for North Carolina, the News & Observer points out that this report comes on the heels of a controversial bill, now revised, which initially suggested using only historical data in planning for sea level rise.
Despite some North Carolina lawmakers' attempt to ignore future predictions, project lead and USGS oceanographer Dr. Asbury Sallenger warned, "Ongoing accelerated sea level rise in the hotspot will make coastal cities and surrounding areas increasingly vulnerable to flooding by adding to the height that storm surge and breaking waves reach on the coast."
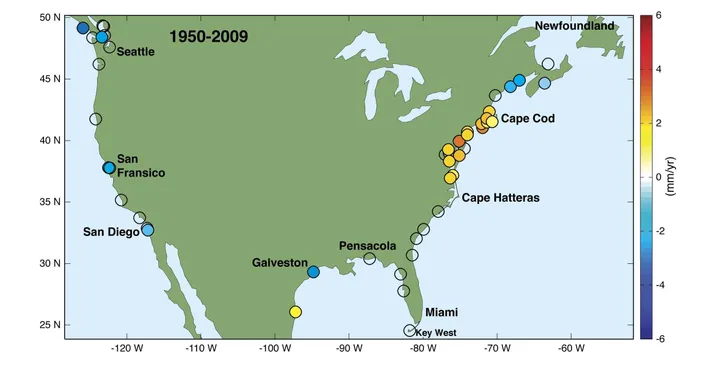
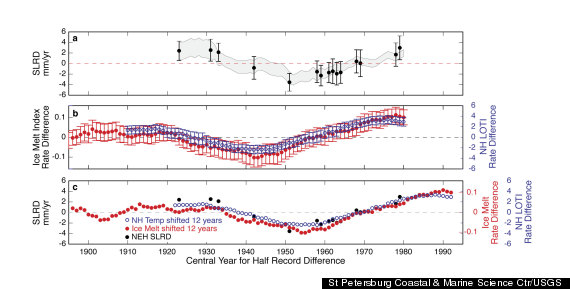
View the images and charts of the hotspot below, courtesy of St. Petersburg Coastal and Marine Science Center/USGS.
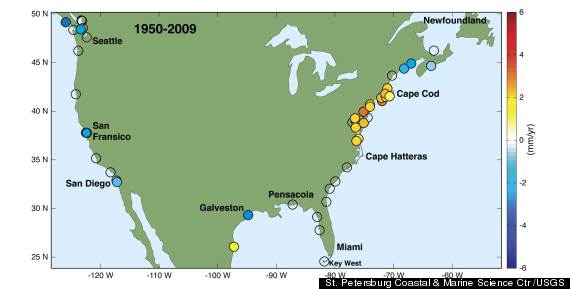
Increases in rates of sea-level rise indicate increasing risk for northeast U.S. coastal cities. Circles are color-coded to reflect computed rate differences during the past approximately 60 yrs. Increasingly red circles indicate tide gauges where increases in the rates of sea-level rise are largest. Open circles indicate gauges where there has been no statistically significant rate increases. The hotspot of increased rates extends north from Cape Hatteras, North Carolina and includes the major coastal population centers in the northeast.