

The period from the fall of the Berlin Wall to today represents not only the highest peak of globalization ever, but also the greatest reshuffle of personal incomes in the world since the Industrial Revolution. It is characterized, in brief, by the rebalancing of the relative income positions of Asia and the West, and the emergence of the "global middle class."
We are in the unique position, thanks to household survey data, to follow these remarkable developments as they occur in real time. This was the purpose of the work I did jointly with Christoph Lakner for the period between the end of communism (1988) to the Great Recession (2008). We used nationally representative household surveys from about 130 countries in the world. This work has been recently updated with the most detailed dataset of household surveys, covering 93 percent of world population for the year 2011.
In addition, the new estimates of countries' price levels, which are crucial for our ability to compare incomes internationally, the so-called international or PPP dollars, were released for the year 2011. This enables us to show all the income data, going back to 1988, in the same prices, making incomes comparable in time -- for each individual country -- and between countries. Most of these data are already available to the general public.
Rising global income
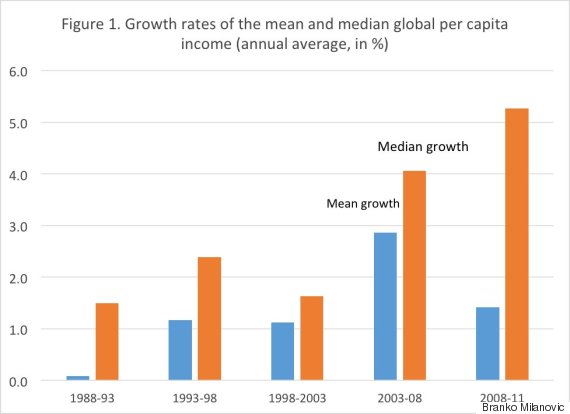
The period 1988 to 2011, as gleaned from household surveys, has been a period of almost uninterrupted growth, globally speaking, but with a very interesting and important twist: the global median income has been rising at a faster rate than the global mean income.
The gap between the growth rates of the median and the mean was due to the extremely high rates of growth of Asian countries such as China, India, Vietnam and Indonesia (China's mean urban income increased by six times!), which all entered this period relatively poor.
When growth is strong in poor countries, even if their own income distributions become more unequal (as happened in China), income at the global median is likely to rise faster than the global mean income. This has been (as shown in Figure 1) the case in all five subperiods we studied. The most revealing is to focus on the last two. The years just prior to the global financial crisis were the years of very large increases in both mean and median, between 3 percent and 4 percent per person annually.
But the slowdown that occurred after 2008 affected the global mean, precisely because the economic slowdown was much more of a problem in the rich countries than in the emerging economies, while the growth rate of the global median even accelerated. (Note that the faster growth of the median compared to the mean tends to reduce global inequality.)
Thus, the period of the financial crisis and its aftermath, which is negatively perceived in the West as a period of almost unmitigated "bad news," was not at all so when considered from the global point of view. On the contrary, far from being a kind of a global turning point, this most recent period simply accelerated already present trends: the economic rebalancing of Asia and the West, continued high growth around the median of the global income distribution, decline in global inequality and the emergence of what we can term the global middle class.
The emergence of the global middle class
The global middle class has recently attracted a fair amount of attention, not least due to a casual observation of the rising standards of living in many formerly poor Asian countries (again China, Indonesia, Vietnam and India come to mind), and the rising demand from these countries for products and services that are generally consumed by the rich and the upper middle class. Figure 2 shows that this perception is indeed based on some hard data.
We define "the global middle class" in a very pragmatic way, using income as the single metric (one should ideally add education levels, housing and wealth, but the data to do so are not easily available) and apply what is by now an almost standard definition, introduced by the World Bank (and recently reused by Pew Research Center). It is such that the membership in the global middle class requires a daily per capita income of between $10 and $100. Figure 2 shows that the share of such people has steadily risen, passing from around 22 percent to 23 percent in the late 1980s and the 1990s, to 28 percent in 2008, and finally rising to more than a third of the world population in 2011.
It is important to explain what these numbers mean. The threshold for belonging to the global middle class of $10 per capita per day is a very low value by Western standards. Only about 6 percent of the Western population lives at that or a lower income level. Some (but not all) of the emerging global class are indeed poor people measured by the rich countries' yardstick. But because the spread of incomes in the world is huge, people with such incomes are not perceived as poor in countries where they live but rather as the middle class.
The amount of $10 per day for the threshold is not wholly arbitrary: it comes from a detailed work on incomes in Latin America, done by the World Bank, which finds that it is a minimum income level that, once reached, makes people unlikely to fall back into poverty again. These households are thus above the category of "vulnerable," and may be considered middle class.
The top amount for the definition of the global middle class, either $50 or $100 per person daily, is less well grounded in any analyses, but is derived from our current perception of income "required" to be middle class in the West. Thus, the "core middle class" -- people with incomes between $20 and $50 per day -- includes 44 percent of the population living in Western countries.
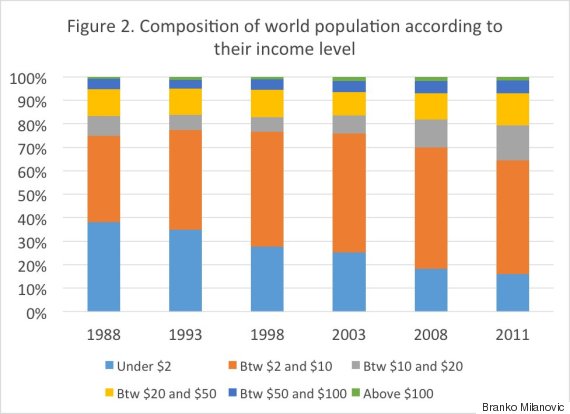
The obverse side of the emergence of the global middle class is perhaps even more remarkable. It is a global transformation, which involves a dramatic decrease in the percentage of world population that can be considered absolutely poor (those with incomes under $2 per day). Their share has more than halved, from 38 percent in 1988 to 16 percent in 2011 (a decrease of 22 percentage points). Figure 2 shows their steady decline in all periods but the first (1988-1993).
Most of those who ceased to be "absolutely poor" had "graduated" into the vulnerable group -- with incomes between $2 and $10 per day -- but others have moved even higher in the income distribution, joining the lower middle class. Thus, a 22 percentage-point decline in the share of the absolutely poor between 1988 and 2011 translates into a 12 percentage point increase in the vulnerable population, 6 percentage point increase in the lower middle class, 2 percentage point increase in the core middle class and 2 percentage point increase among the upper middle class and the rich.
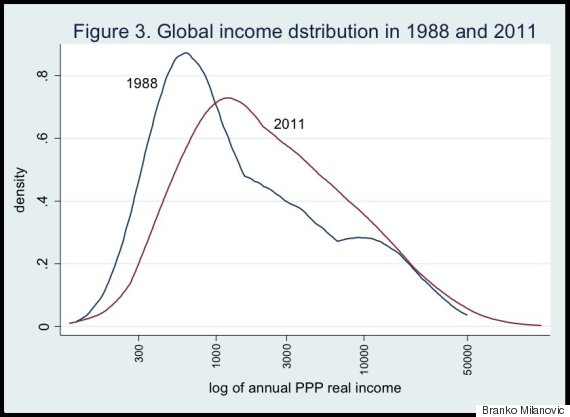
All of these developments are reflected in a remarkable change in the shape of the global inter-personal income distribution. As shown in Figure 3, it has moved to the right (toward higher values) and lost its distinctive shape of "twin peaks" -- a high share of the very poor and, somewhat less, of the very rich -- and has become much "thicker" around the middle. Figure 3 displays the "bulge" which exactly corresponds to the rising share of the global middle class.
Rebalancing the world: Asia and the West
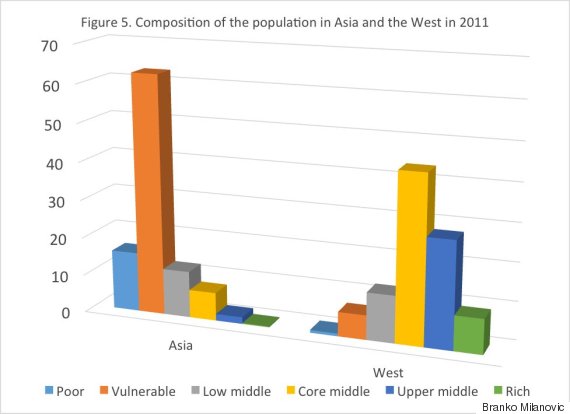
In geographical and perhaps in geostrategic terms, the most dramatic change is between the relative positions of Asia and the West. Figures 4 and 5 show the composition of the population, divided into the same six "classes," in Asia and the West in 1988 and 2011.
Western distribution in 1988 shows the usual symmetrical pattern with almost half of the population in the core middle class group and only 14 percent among the vulnerable. In Asia (which is defined here in geographical terms, from the Middle East to Japan and the Philippines) an astonishing 92 percent of the population was either vulnerable or poor, and more than half were indeed absolutely poor.
But in 2011, while 80 percent of Asian population remained poor and vulnerable, the percentage of the absolutely poor has dropped to only 16 percent. So, the main "axis of change" was "graduation" from being poor and moving into the vulnerable group. Accordingly, the shares of the other, more affluent, groups have risen. 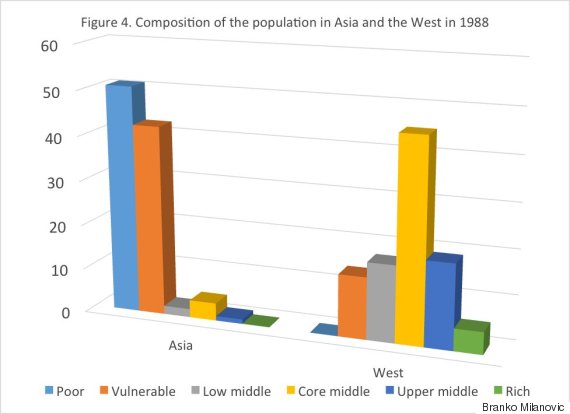
The 2011 comparison between Asia and the West shows that the differences in income between the rich countries of the West and Asia, while diminishing, are still very substantial. However, it is the comparison with the starting point of the two in 1988 that allows us to assess much better the enormous progress achieved by Asian countries; a progress that is perhaps even better seen when contrasted with the lack of progress in Africa (not shown in the graph here). In 1988, the percentage of the absolutely poor in the two continents was about the same (51 percent of the Asian population and 49 percent of the African population). By 2011, the percentage of the absolute poor in Asia had dropped, as we have seen, to 16 percent, while in Africa it remained almost unchanged, at 47 percent.
What next?
Economists tend to see the future generally as an extension of the current trends. But of course we cannot be sure that the current trends will continue: wars or major economic dislocations, climate change, epidemics, migrations -- particularly in the era of globalization where bad development (like epidemics) can spread to the four corners of the world easily -- cannot be excluded.
With that caveat in mind, if we believe that the next 25 years will resemble the period we are exiting now, we can expect further growth of the global middle class, especially in Asia, convergence of Asian and Western income levels, and further (relative) falling behind of Africa, a continent whose income performance in the past 25 years has been disappointing.
With these trends, global inequality may continue to decrease. However, that decrease may not be as strong as it might seem to us now for at least three reasons. Most of the decrease in global inequality over the past 25 years was driven by wealth-creation in China. But as China becomes richer and the majority of its population begins to enjoys incomes above the world mean, its further faster growth will tend to exacerbate rather than to decrease global inequality, especially if it continues to leave behind populous African countries like Congo, the Sudan, Ethiopia, Nigeria and others.
The second reason which may slow down the decline in global inequality is precisely the sluggish performance of big African countries, which in addition are expected to register large population increases (thus increasing the share of the poor in the world population).
And lastly, income growth among the super-rich who are already now inadequately represented in the surveys and thus bias our inequality estimates down, will most likely continue. If their incomes continue to grow at higher rates than the average, this can halt the drop in global inequality, while bringing to the fore the issues of control of the political processes by the rich, tax evasion and ostentatious living.
