
Toward the end of any election campaign in which polls are omnipresent, attention inevitably turns to "the undecided" voters and their potential to shake up the race in its final hours.
In 2016, as is often the case, this focus is misguided. One reason, particularly in the context of presidential elections, is that truly undecided voters are few and far between. SurveyMonkey's nationwide Election Tracking, for example, finds just 2 percent of likely voters who are still totally undecided about a choice between Trump, Clinton and third party candidates Gary Johnson and Jill Stein.
That said, there are far more people -- 7 percent of likely voters -- who choose a candidate but also say (on a follow-up question) that their chance of voting for that person is just "50-50" or less. Let's call them uncertain voters.
Ordinarily, polls have difficulty yielding statistically meaningful results about undecided or uncertain voters because the subgroups are too small. SurveyMonkey interviewed just over 43,000 likely voters in the past week, however, so we have ample data for these critical subgroups.
A closer analysis of 4,007 likely voters who are either undecided or uncertain -- including 1,049 who are totally undecided -- finds no evidence of a "hidden vote" lurking that might upend the race.
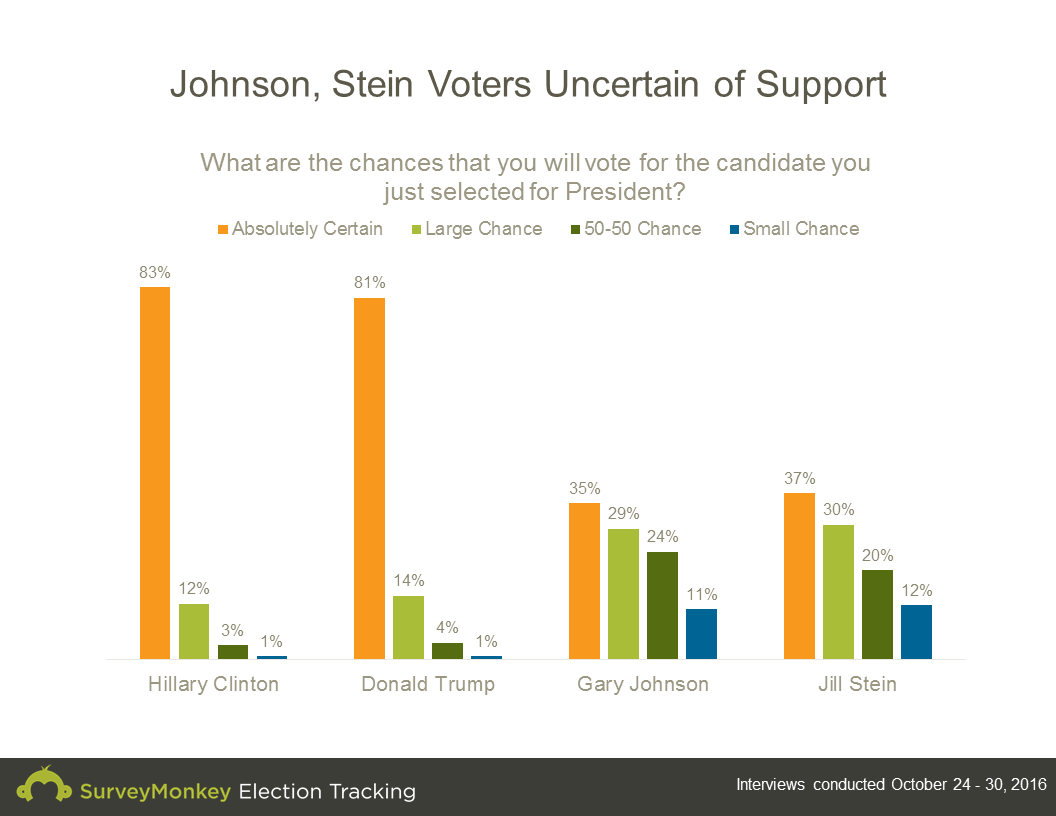
Let's take a closer look. First, any discussion of the uncertain and undecided vote in 2016 needs to begin with voters supporting third party candidates, as their support is unusually high compared to recent elections. Also, these voters are less certain of their support than those currently favoring Clinton or Trump.
More specifically, nearly all Clinton and Trump supporters say there's at least a "large chance" they will actually vote for their chosen candidate, and 81 percent of Trump voters and 83 percent of Clinton voters say they are "absolutely certain" about that choice. By comparison, just 35 percent of voters supporting Johnson and 37 percent of those supporting Stein say they are absolutely certain, and only about two-thirds say there's a "large chance" or better they'll end up voting for that candidate (again, note the exceptionally large sample sizes, over 3,042 likely voters for Johnson, 1,017 for Stein).
SurveyMonkey's tracking has shown support for Gary Johnson gradually declining since the summer, from 11 percent among all registered voters in mid-August to just 6 percent among likely voters this past week. Similarly, support for Jill Stein has fallen from 5 to 3 percent over the same period. Will any further erosion change the margin separating Clinton and Trump?
Currently, Clinton leads Trump by 7 percentage points (51 to 44 percent) on a two-way vote question, but by 6 percentage points with third party candidates included. That gap exists mainly because supporters of Jill Stein favor Clinton over Trump overwhelmingly (57 to 15 percent) in a two-way race. Yet Stein's overall support remains relatively low, and only some of it uncertain, so the potential for a shift to Clinton is minimal.
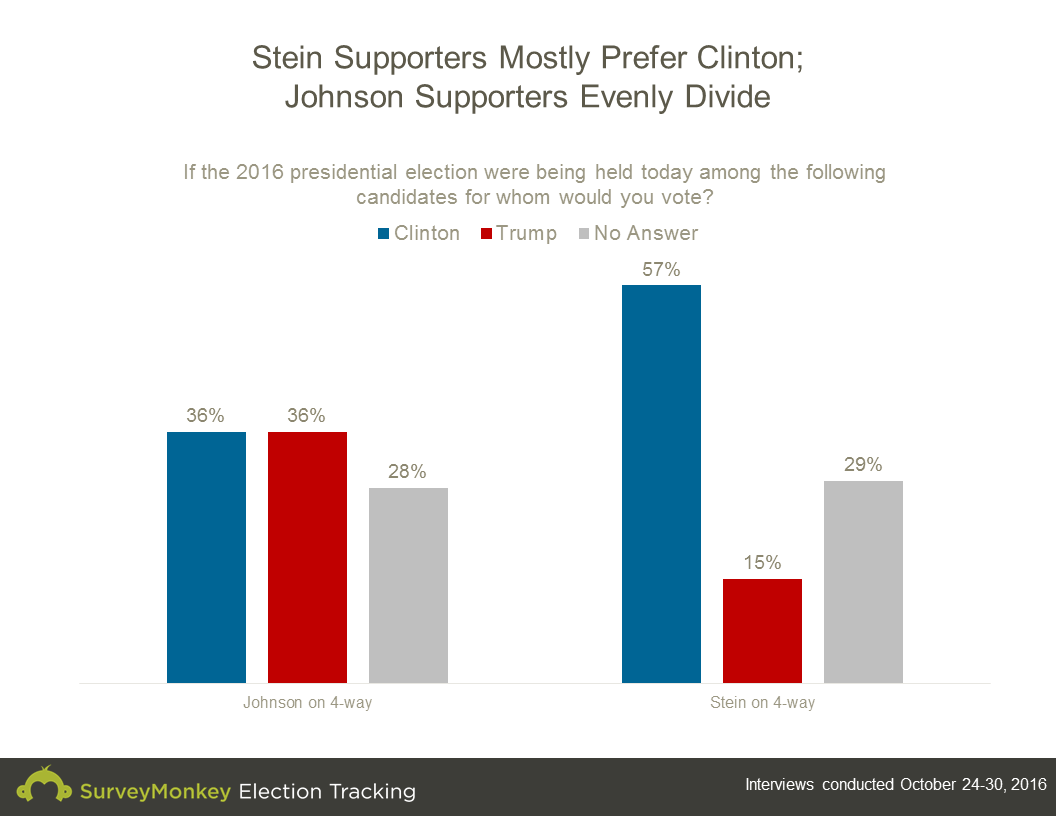
Gary Johnson's support, which has been consistently higher than Stein's, is a somewhat different story. His voters currently divide right down the middle (36 percent each) on whether they'd prefer Clinton or Trump in a two-way race, so a continuing decline for Johnson is still unlikely to affect the margin separating Clinton and Trump.
Other measures yield no evidence of a hidden vote or an impending late "break" of the undecided or uncertain voters toward either Clinton or Trump. Whether we focus on the totally undecided 2 percent or the 9 percent that also includes the uncertain, these potentially persuadable voters divide nearly evenly in terms of their partisan leanings and impressions of Clinton and Trump.
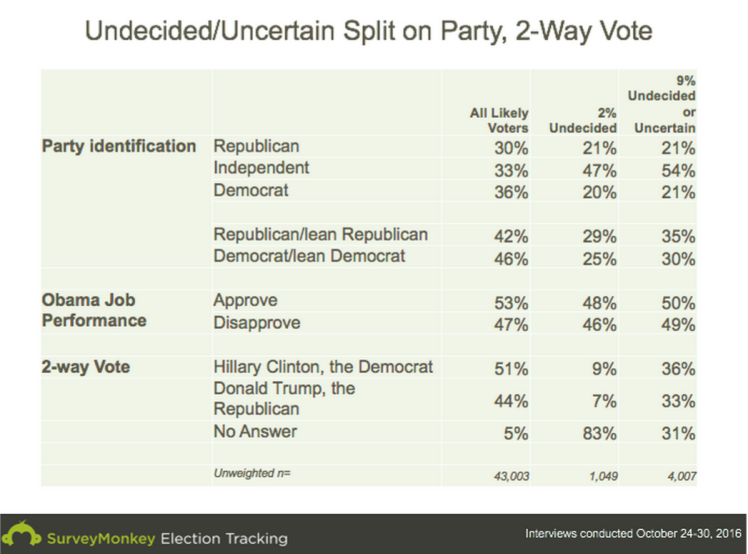
On party identification, nearly half of the totally undecided (47 percent) and even more of the uncertain voters (54 percent) identify as independent. Those that remain break almost evenly among the two parties -- 21 percent Republican, 20 percent Democrat among the totally undecided, and 21 percent for each party among the larger pool of undecided and uncertain voters.
With leaners included, Republicans and Republican-leaning independents slightly outnumber Democrats and Democratic-leaning independents among both the undecided (29 to 25 percent) and the larger pool of undecided and uncertain (35 to 30 percent).
They also divide almost evenly on President Obama's approval rating: 48 percent of undecided voters and 50 percent of all undecided and uncertain voters approve of the job President Obama is doing.
Despite a slight Republican lean, the undecided and uncertain voters also show a slight preference for Clinton on a two-way vote choice (by 36 to 33 percent among all undecided and uncertain voters, and by 9 to 7 percent among those totally undecided on the vote with third party candidates included).
The low favorable ratings for both candidates help demonstrate both why so many of these voters are uncertain about their choice and why, when pressed, slightly more lean to Clinton than Trump.
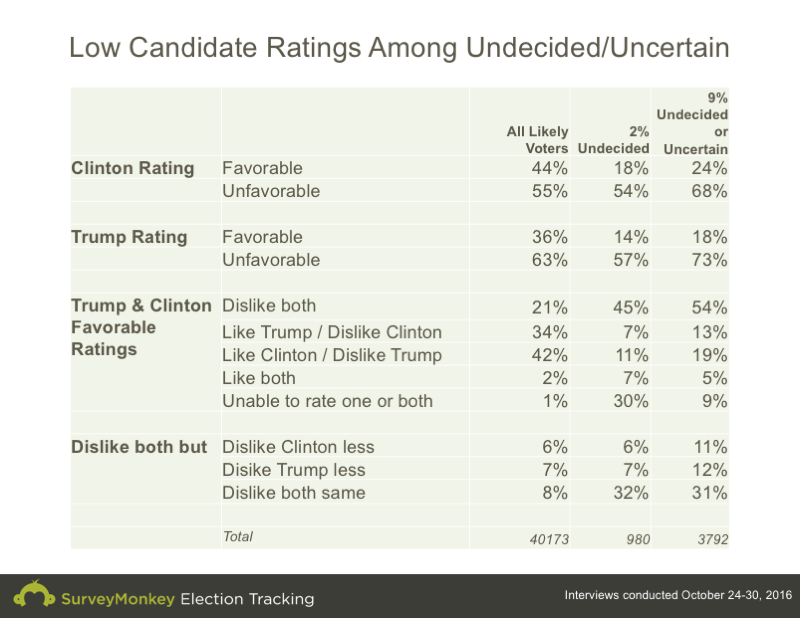
The patterns are similar for both, but consider the 9 percent that are either undecided or uncertain about their choice: Clinton's favorable rating (24 percent) is low, but Trump's is lower (18 percent). Her unfavorable rating is high (68 percent) but his is even higher (73 percent).
Not surprisingly, those uncertain or undecided about their choice are far more likely to rate both Clinton and Trump unfavorably (54 percent) than are all likely voters (21 percent). The dislike of both candidates is a big part of the reason so many of these voters are uncertain in the first place. However, even among these voters, many dislike one candidate more intensely than the other, so the 54 percent who dislike both breaks out into 11 percent who dislike Trump more than Clinton, 12 percent who dislike Clinton more than Trump and 31 percent who dislike both with the same intensity.
So again, while indecision remains a factor in the final week of the race for president, nearly all likely voters have made their minds up about Clinton and Trump. While some are still deciding between the lesser of two perceived evils among the major party nominees, a third party candidate, or perhaps not voting at all, the sum of those decisions does not appear poised to upend the race.
This SurveyMonkey Election Tracking survey for October 24th, 2016 through October 30th, 2016 was conducted online among a national sample of 44,396 registered voters. Respondents for this survey were selected from the nearly 3 million people who take surveys on the SurveyMonkey platform each day. This entry is cross-posted to the SurveyMonkey Election Tracking blog
Correction (11/2/16): The title of the second chart above has been corrected to accurately characterize the results. Johnson supporters are evenly divided, not leaning more towards Trump.