
My model-based poll average points to a close result in the national popular vote. The national popular vote has been indistinguishable from 50-50 since the first debate, with hints of a modest shift back towards Obama when recent polls are added to the modeling.
At the same time, the model estimates that Obama's support in key swing states lies above 50%. The latest run of my model estimated Obama's support in two-party terms to be 51.9% in Nevada, 51.7% in Wisconsin, 51.5% in Ohio, 51.4% in Iowa, 50.7% in Colorado, and 50.3% in New Hampshire. In Virginia, my model estimates Obama support at 50.1%, 49.7% in Florida and 48.7% in North Carolina.
The estimates for each state are just that -- estimates -- and are accompanied by uncertainty. For each state we translate that uncertainty into the probability that Obama leads Romney. In turn, this induces uncertainty into the allocation of the state's Electoral College votes and also over the total Electoral College count for each candidate. Uncertainty over the Electoral College count takes the form of a probability distribution (or, more precisely, a probability mass function) over Electoral College counts.
Based on the most recent set of estimates produced by my model, the distribution characterizing uncertainty in Obama's Electoral College count lies almost entirely to the right of 270. The expected or average outcome is 304 Electoral College votes for Obama, although 290 is the single most likely outcome (observed with 13% probability).
If Obama were to win 290 Electoral College votes -- or 53.9% of the Electoral College's 538 votes -- he would be outperforming his current "as good as tied" standing in national polling, by almost 4 percentage points. 304 Electoral College votes would be 56.5% of the Electoral College.
How plausible is this level of Electoral College "overperformance"? What do past elections say about the relationship between national-level vote shares and Electoral College outcomes?
The graph below shows what political scientists call a "seats-votes curve" for the Electoral College, estimated using data from the 20 presidential elections spanning 1932 to 2008. On the horizontal axis we have Democratic share of the national, two-party vote cast in each presidential election, expressed as a percentage. On the vertical axis I plot the Electoral College outcome for each election, ignoring any Electoral College votes not going to the nominees of the two major parties (but expressing the results as if 538 Electoral College votes were allocated to the two major parties in each election).
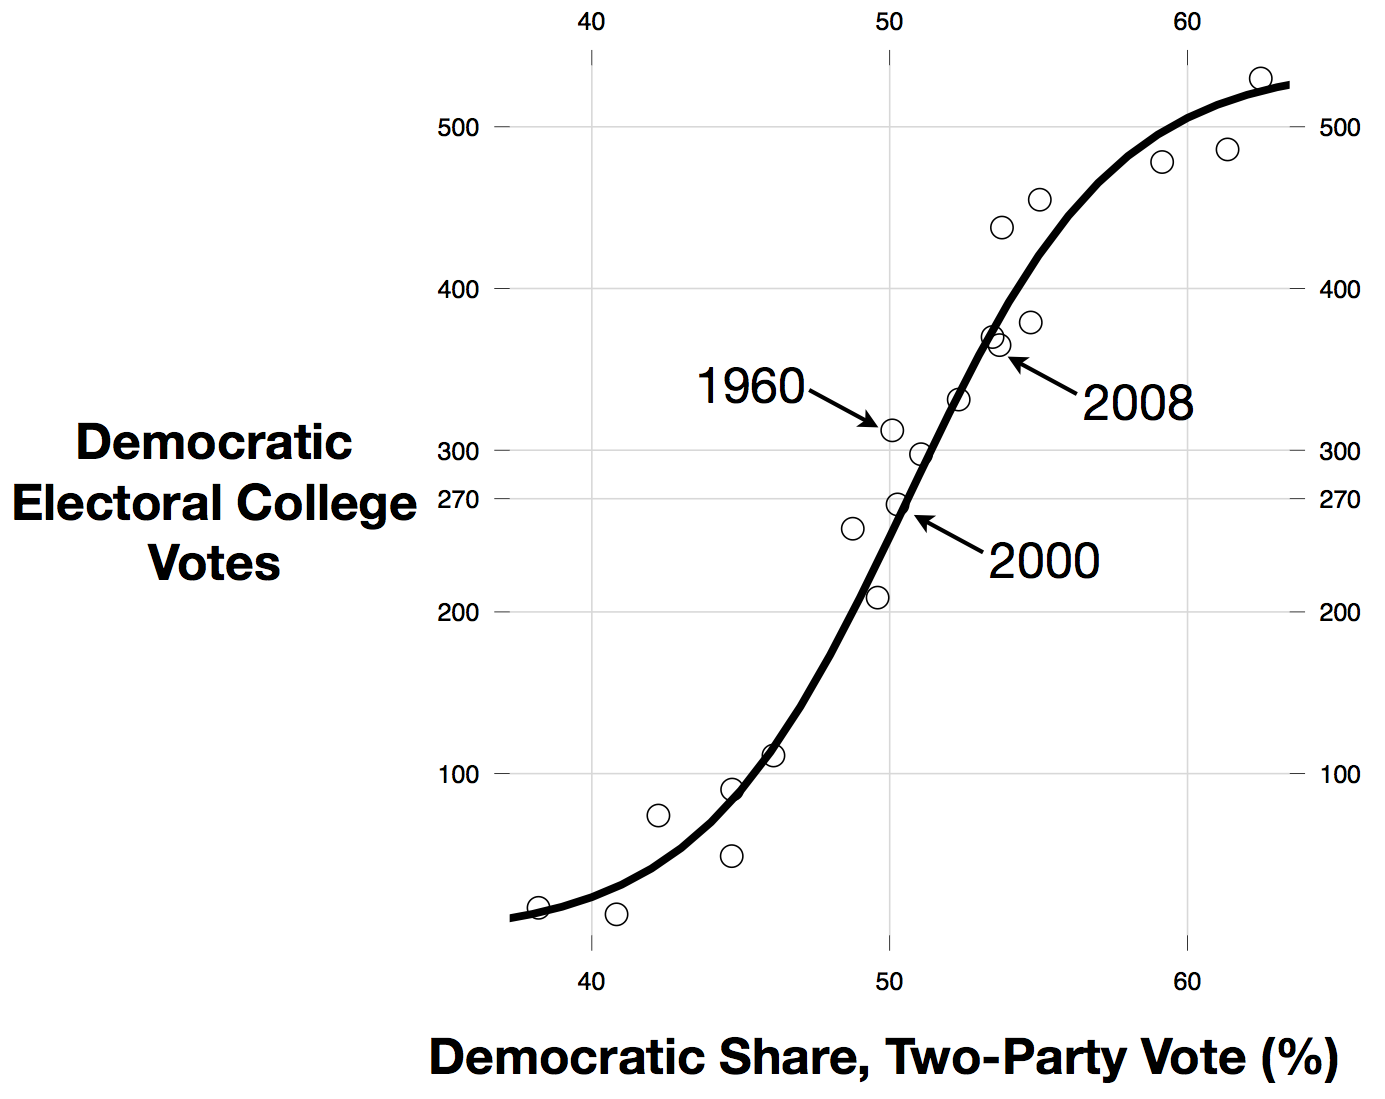
The dark line on the graph is a line of "best fit." Note that it falls slightly below the 50% two-party vote, 270 Electoral College mark. That is, averaged over the 1932-2008 period, Democratic candidates have usually needed a little more than 50% of the national two-party vote to win 270 or more Electoral College votes. Recall that in 2000, Gore won 50.26% of the national, two-party vote and 49.5% of the Electoral College votes. On average, 50% of the national two-party vote translates into 247 Electoral College votes (95% CI: 122 - 380).
That is, it is hardly out of the realm of possibility for a Democratic candidate to win a presidential election with 50% of the national, two-party vote (or less), but it is somewhat improbable. Indeed, the analysis here implies that the probability of a Democratic win in the Electoral College given a 50-50 result in the two-party, national vote is 36.6%.
One of the biggest mis-matches between the national two-party result and the Electoral College result is the 1960 result. Kennedy won 50.1% of the national, two-party vote but 303 Electoral College votes (58% of the two-party, Electoral College result). Not coincidentally, this was the last time a candidate for the presidency won without winning Ohio.
The probability of winning 290 Electoral College votes (or more) -- 53.9% or more of the Electoral College -- given 50% of the national-two party vote is lower, 26.3%. The probability of winning 304 Electoral College votes (or more) under this scenario is 20.2%. If anything, the estimate of Obama's national two-party vote share is trending up ever so slightly, and was 50.2% in the most recent run of my model (as of the time of writing). With 50.2% of the two party vote, the probability of an Electoral College win is 40.8%, 290+ EVs has 29.9% probability and 304+ EVs has 23.3% probability.
That is, the scenario we're seeing in the polling today is somewhat unusual given the historical record, but not freakishly so. It might be even less unusual by Election Day.
In short, where Romney's winning, he's almost always winning by a lot. Obama's leading in more than a few states by just a little, generating a more efficient translation of support into Electoral College votes than Romney. How this came to be will be a big part of the narrative of how the 2012 election was won or lost.
Technical notes: the line on the graph is actually a regression line, produced by fitting a regression to the log-odds of the Democratic nominee's Electoral College share of the two-party Electoral College vote on the log-odds of the Democratic share of the national, two-party presidential vote. While linear on the log-odds scale, these seats-votes regressions typically produce sinusoidal curves when plotted on the scale of the proportions. If the Electoral College were based on proportional representation (rather than winner-take-all, by state, except for Maine and Nebraska), the fitted surface would be a 45 degree line. The fitted log-odds on log-odds regression here has an intercept of -0.17 and a slope of 7.2; the r-squared is 0.95 and the residual standard error ("sigma hat") is 0.47. Simulation methods were used to induce confidence intervals and probabilities for the scenarios discussed above; I implemented a Bayesian regression model in JAGS with some extra computation to derive posterior predictive densities over Electoral College counts given 50% national, two-party vote shares, etc.