Ever since Senator Barack Obama's historic election as the first African-American President, the pundits have been trying to demystify the voter attitudes and behavior that led to this unprecedented outcome. Using a novel public opinion measurement methodology named Bullitics (www.bullitics.com) that I developed with Yosem Companys through our research at the University of Michigan and Stanford University; I was able to track in real time the micro trends that led to President-elect Obama's landslide victory on November 4. I present here the changes in people's perception of the presidential candidates and dissect the specific parameters that affected the results we observed on Election Day.
Here, we illustrate five key takeaways:
1.While everyone knows that the economy was an important issue that helped Senator Obama to win the election, few know the actual quantitative change and how the magnitude of this effect tilted voter perceptions in Obama's favor.
2.While pollsters guessed at the effect that the exclusion of cell phones in polls would have on the accuracy of those polls, we proved that cell phones had a significant impact and that people with cell phones (only) tended to vote differently from the larger population. While Senator Obama was in a virtual dead-heat with Senator John McCain among landline phone voters, he was ahead by nine points when cell phone voters were included.
3.Republican strategists and some pundits have been bashing Governor Sarah Palin, arguing that her pick led to the demise of Senator McCain's chances to win the presidency. In fact, the opposite is true. Governor Palin actually was a great pick for Senator McCain. She provided a bounce for Senator McCain that held strong well beyond her weak performances on network television bolstered her negatives in the eyes of the American people. Her initial impact made voters give McCain a second look... and some stayed for good.
4.Most pundits and pollsters assumed that all battleground states were created equal. While the states looked like toss ups, our novel analytics helped us differentiate them in greater detail from how committed people were to a candidate and how likely they were to change their preference.
5.A debate has raged on whether there was a Bradley effect (named after Los Angeles Mayor Tom Bradley who lost his mayoral campaign after the polls suggested he would win by a wide margin) or a reverse Bradley effect. Using our novel analytics, we found that the racial effect was negligible or at least small relative to other larger issues.
Let's explore these surprising findings in further detail below. As late as September 10, 2008, Senator McCain seemed well poised to win the election. This data was tabulated after the convention; thus, the data include the positive electoral bounces that Democratic and Republican candidates usually experience after their conventions. Our most likely scenario at the time had Senator McCain and Senator Obama tied at 269 electoral votes. This makes it an interesting starting point for the evaluation of factors as the tally between the two was electorally even. The five factors cited above, however, had a dramatic impact in the subsequent months, leading Senator Obama ultimately to defeat Senator McCain in a landslide.
1. The Economy
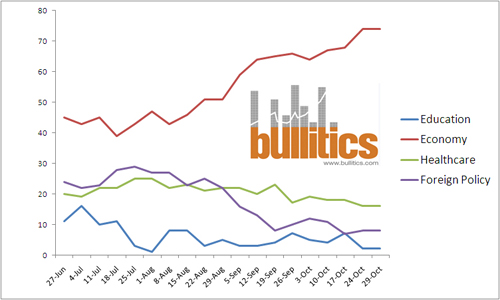
Once the economy started on a downward spiral, so did Senator McCain's numbers. In a study conducted over two months, our data suggests that Senator McCain's numbers were strongly correlated with market activity. As the markets dropped to historic lows, Senator McCain's support also experienced a steady decline. Moreover, voters who before September 10 thought the economy was the most important issue switched their votes from Senator McCain to Senator Obama at an alarming rate of 11:1. Among voters two weeks before the election who thought the economy was the most important issue, Senator Obama was the preferred candidate by almost a 3:1 margin (71%-29%). Amongst the "top issues" evaluated, Senator McCain only led Senator Obama with voters who felt that foreign policy was the top issue (68%-32%). These numbers imply that an economic disaster enhanced Senator Obama's candidacy, just as an international incident would have enhanced Senator McCain's position. Our study showed that the economy has consistently been the top issue for most of this election, but the margin increased significantly. For perspective; the ratio between the economy, health care and foreign policy for voters was 4:2:2 before September 5, 2008. By October 29, 2008, the ratio had ballooned to 7:2:1 (see figure). This shift is even more impressive as it can be categorized as an "intrinsic shift". In other words, the shift was consistent throughout all states, regardless of the distinction of blue, red, or battleground state (r^2=0.88).
2.Cell Phone Dynamics
The question of cell phones and the population that owns them and not a landline has been a key concern for pollsters this election cycle. Using our trademarked Quasi-Experimental Scientific Study (QESS) techniques, we segregated users based on exposure to a treatment. The result? We determined that there were a significant number of voters who owned cell phones but did not own landlines. In fact, the number of voters with these characteristics was significant in the 18-34 year-old demographic group. Our results showed that, likely, voters in this age group that owned cell phones and did not own land lines tended to favor Senator Obama by a two-to-one margin. This was about a 12% point shift from those within the same age group that owned landlines. When merged with all age groups, this shift was responsible for a 4 point shift in the polls (for a total of 8%).
3.The Palin Effect
Contrary to popular belief, the Palin Effect was a positive one for Senator McCain. While it is true that her favorability ratings dropped dramatically among voters after the first two weeks (see graph), Senator McCain's numbers experienced a significant increase after her nomination, and they remained high even as Governor Palin's numbers dropped. This suggests that Governor Palin's nomination made voters take a second look at Senator McCain, and those who were pleased with what they saw, stuck with him for the remainder of the race. A week before the election, Governor Palin's favorability numbers had dropped to the mid 20's, while McCain's hovered around 50. Thus, strategically speaking, the Palin vice presidential pick was a successful one and is unlikely to have cost Senator McCain in the voting booth.
4.Volatility and Commitment Indexes
In a study of the 10 battleground states (name), we measured the volatility and commitment index of the voters as a function of time. Within these battleground states, we could assess those that were more likely to shift away from the current polling values, by assessing the following two factors: First, "how committed the voting population was"; and second, "how likely they were to shift their votes". These two parameters enabled us to rank the states according to a combined index. The result? All of the states, with the exception of Missouri and Virginia, shifted strongly towards Senator Obama; and all of the shifts were within the described volatility and commitment indexes. But why was the shift not seen in Virginia or Missouri? We turn to the next point to answer this question.
5.Reduced Racial Bias
The so-called "Bradley Effect" was not as significant as many pollsters and pundits anticipated. In an experimental study, we gave likely voters the chance to switch their votes if they perceived their candidate as "lacking experience" or as "not knowing too much about the candidate". We surmised that these were two of the main reasons why voters might object to an Obama candidacy. We took the national average of people who picked Senator Obama, but who objected to a candidacy based on these two issues, and looked for any state that was 1.5 standard deviations above this mean. The only states that were clearly above the national average on this front were Missouri, Pennsylvania and Virginia. Two of these states tended towards Senator McCain relative to the expected spreads from the threshold polling numbers. These states were also significantly higher (more than 1.5 standard deviations) than the national mean when asked if "race could affect the election outcome." So although the racial impact was small nationally, one may interpret these results as being significant in some local areas. Coupled with the volatility results, this may yield some insight as to why MO and VA where the only two battle ground states that diverged from the general trend towards Senator Obama relative to the poll numbers.
3 days before election night, our system predicted the "best case" and "most likely" scenarios for Senators Obama and McCain. To obtain these numbers, we used a combination of our threshold percentage distribution (i.e., the polling numbers), coupled with our volatility and commitment indexes for each state. For the best case scenarios, we shifted all of the battleground states towards a 95th percentile shift for a particular candidate. For the most likely scenario, we coupled all our data, without shifting it in favor of any candidate; with the additional bias of our cell phone effect study. Our results were the following:
•Senator McCain's best case scenario: Obama 270: 268 McCain
•Senator Obama's Best case scenario: Obama 378:160 McCain
•Most Likely Scenario: Obama 364: 174 McCain
Thus, unlike many other Americans, we went to sleep soundly on election eve confident that Senator Obama would win the presidency and -- at worst -- win by two electoral votes.