UPDATE: Fox News issued a correction on Tuesday, according to Media Matters. "America's Newsroom" showed a revised chart, which is what Bill Hemmer said the graphic "should have looked like."
"That was our mistake," he said. "Correction noted."
ORIGINAL STORY: A Fox News graphic about Obamacare enrollment levels looked juuuuuust a bit off on Monday.
It showed a bar chart comparing the number of Obamacare enrollments as of March 27 — 6 million — to the original projection of 7 million by March 31 from the Congressional Budget Office. There was a slight problem with the way the network portrayed things, though, as Media Matters noted.
Think you can spot it?
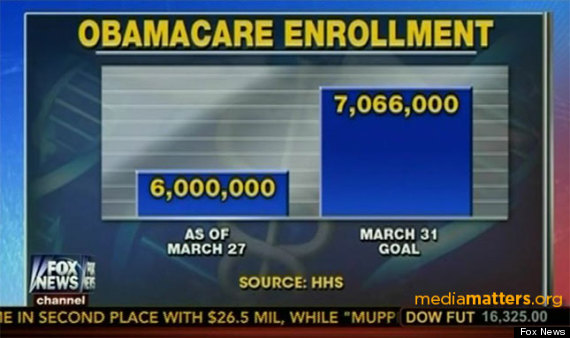
If you couldn't spot it, 7 is just a bit more than 6, not 1000 times more (or whatever the chart had, we're bad at math)!
The graphic aired during Monday's "America's Newsroom" during a discussion of how Obamacare will affect Democrats running for election this year. While the CBO had initially predicted last May that 7 million people would be enrolled in the new health care exchanges by March 31, it later decreased that projection to 6 million following the botched rollout of Obamacare last fall.
People quickly went about correcting Fox News's chart for them:
Hey @FoxNews I fixed your Obamacare chart for you! (HT @mattyglesias) Yours: pic.twitter.com/a5VKCYqrAs Fixed: pic.twitter.com/faEIJd3kLr
— James Ball (@jamesrbuk) March 31, 2014