

WASHINGTON -- With the race for president between Mitt Romney and Barack Obama now shifting into high gear, politicians, journalists and the general public are scrutinizing each new poll, with every small swing in one direction or another elevated to outsized importance.
Among the many polls released every day, one always stands out. The Gallup Poll is arguably the most trusted survey brand in the world, a name virtually synonymous with public opinion polling. It has measured presidential job approval and vote preference without interruption since the 1940s and now conducts a daily tracking poll that reaches more than 3,600 adults every week -- a volume of data that dwarfs that produced by other firms. As a result, Gallup's numbers enjoy unique influence and public prominence.
Over the past few years, however, polling junkies have noticed something curious: Gallup's polls have produced results that appear slightly but consistently more negative to President Obama than those produced by other firms.
The Huffington Post has conducted an independent analysis that confirms the phenomenon and points to a likely explanation. The problem lies in the way that Gallup handles the racial composition of its samples, and the findings highlight significant issues with how polls are developed and conducted today.
The dirty little secret of telephone surveys now conducted by most media outlets is that their unweighted samples alone cannot provide reliable estimates of population demographics like race and Hispanic ancestry. A dramatic fall in response rates has led to what pollsters call "non-response bias" in their raw data. Partly because survey response rates are typically lowest in urban areas, unweighted samples routinely under-represent black and Hispanic Americans.
As a Pew Research Center study recently demonstrated, random-sample surveys continue to provide accurate data on most measures -- but only when their samples of telephone numbers include both landline and mobile phones, and only when the completed interviews are weighted to match the demographic composition of the population. That means the weighting procedures that pollsters use are critical to producing accurate results.
The need to weight accurately by race and ancestry is particularly significant when it comes to evaluating the contest between Obama and Romney. As Gallup itself reported in early May, Romney led Obama among non-Hispanic white voters by 54 to 37 percent, while the president had the support of more than three-quarters of non-white registered voters (77 percent). Obama's support among African Americans on Gallup's tracking poll stood at 90 percent.
That gap makes the way pollsters account for race hugely important. When pollsters weight their samples to match population demographics, every percentage point increase in black representation translates into a nearly one-point improvement in Obama's margin against Romney. The difference of just a few percentage points in the non-white composition of a poll can produce a significant skew in its horse race results.
THE HOUSE EFFECT
When journalists and political insiders began to take note of the apparent skew in Gallup's results favoring Romney, the firm's senior editor, Lydia Saad, warned that "any number of factors could cause polls by different firms to produce different results."
These factors -- known collectively as the "house effect" -- include survey dates, question wording and order, sampling and calling procedures, and the way pollsters weight their data.
"One cannot fairly evaluate the accuracy of any one poll against another," Saad wrote, "without reviewing all of these variables." She considered arguments made by others that the racial composition of Gallup's samples could be used "as a basis for evaluating the results" and rejected them.
Indeed, when HuffPost initially looked at the same arguments, we concluded that the small apparent variation in racial composition, in the context of a handful of polls examined, made little difference.
More broadly, Frank Newport, editor-in-chief of the Gallup Poll, said in a statement to HuffPost, "We believe Gallup's methodological procedures -- including our land-line and cell-phone sampling procedures, household and respondent random selection procedures, interviewing procedures, and post-survey weighting procedures -- represent the highest standards in the field. These have been carefully designed to maximize the accuracy of our surveys as a whole, as well as for all major subgroups surveyed."
But when HuffPost did a closer analysis of the Gallup polls, more significant issues emerged.
We reviewed Gallup's polls over a two-week period from April 11 to 26.
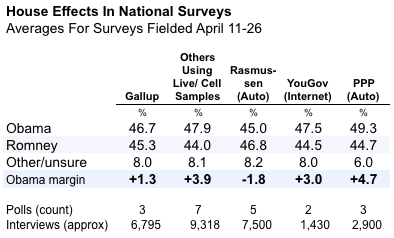
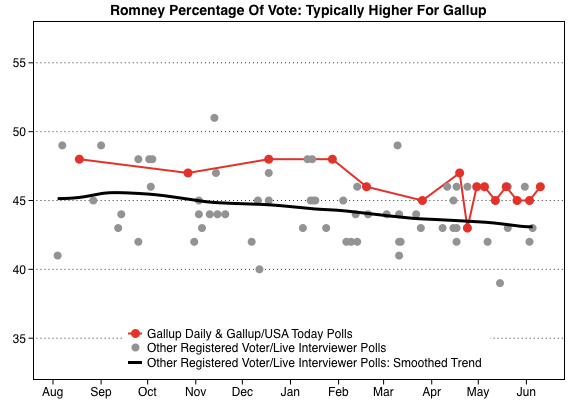
Gallup's interviews showed Obama leading Romney by an average of 1.3 points (46.7 to 45.3 percent). Seven other national surveys conducted during that timeframe using similar methods put Obama ahead by a wider, 3.9-point margin (47.9 to 44.0 percent).
Like Gallup, the other pollsters -- CBS/New York Times, CNN/ORC International, Fox News, NBC/Wall Street Journal, the Pew Research Center, Quinnipiac University and Reuters/Ipsos -- used live interviewers, sampled both landline and mobile phones, and reported results among self-identified registered voters. But question order, question wording and timing varied (the Gallup interviews were spread out across the two weeks, whereas the polls by other organizations were more heavily clustered in the first week).
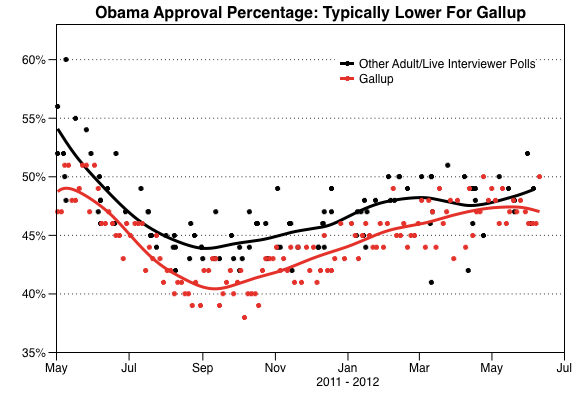
To try to control for other factors, we also examined polls that measured Obama's job approval rating among all adults over much longer periods of time. Gallup's average job rating for Obama over the past year is 44.4 percent, 2.6 points lower than the average job rating from six of the seven organizations using similar methodologies. (The Fox News surveys were omitted because they report job approval among registered voters, not all adults.)
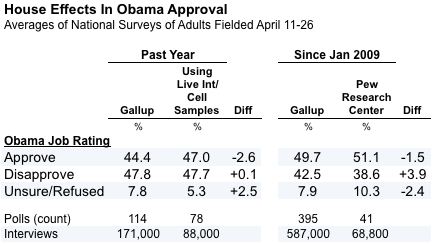
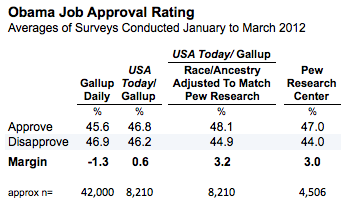
In addition, we compared Gallup's results on Obama's job approval rating since January 2009 with the parallel monthly surveys conducted by the Pew Research Center. Over that period, too, Gallup's Obama job approval average, 49.7 percent, is a little more than a percentage point lower than the average number found by Pew Research.
That difference may seem small, but the enormous number of interviews involved -- nearly 70,000 for Pew Research and more than 500,000 for Gallup -- make this relatively small difference statistically significant.
ISSUES OF RACE
For estimates of race and other demographics, pollsters typically turn to the highly reliable data produced by the U.S. Census. They sometimes look at the full Census, but since that occurs only once every 10 years, many depend instead on the more frequently fielded Current Population Survey or the American Community Survey.
The CPS and ACS feature in-person interviews, enormous sample sizes and very high response rates, making them some of the most reliable surveys available. The CPS, for example, talks to roughly 60,000 U.S. households per month and typically achieves a 90 percent or better response rate.
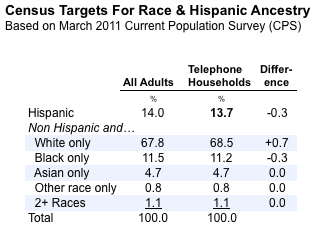
Gallup currently weights its adult samples to match the March 2011 CPS, the largest monthly CPS sample that is currently available to the public.
Gallup adds an unusual twist, however, which most other widely reported independent national polls do not: It filters the CPS data to use the estimates for adults "living in U.S. telephone households." Thus, rather than weighting its survey to match the demographics of all adults, Gallup removes a small sliver of adults (3.2 percent) who have no access to telephone service of any kind, either landline or mobile.
The omission is consequential because the majority of Americans who lack all forms of phone service are non-white. In the March 2011 CPS, 54.4 percent of adults living in non-telephone households reported they were Hispanic, black or another race other than white, compared to 31.5 percent of adults with telephones.
Why filter out telephone households? According to Jeffrey Jones, managing editor of the Gallup Poll, "that is our usual approach, to match the weighting targets as closely as possible to our sample universe."
Most other pollsters have opted to go in a different direction, basing their weighting targets on the full population, since that is ultimately what their polls of "all adults" endeavor to measure. By filtering out the non-telephone households, Gallup slightly underestimates the number of blacks and Hispanics in the full population.
The way Gallup asks its survey respondents about their race is also unusual.
Starting in 2000, the Census Bureau made an important change: Rather than asking respondents to identify themselves as belonging to a single racial group, it began accepting more than one answer to the race question. CPS interviewers read off a list of racial categories and ask respondents to "choose all that apply." If respondents offer more than one response for race, the CPS interviewers record it.
A small number of non-Hispanic adults -- 1.4 percent on the 2010 Census, 1.1 percent of adults on the March 2011 CPS -- now select two or more categories on the race question.
Gallup, to its credit, is one of the few polling firms to try to adapt its format to allow for more than one answer to the race question. This change, as Jones explained via email, "is a way for people to identify as more than one race, to account for the growing multi-racial population," and to conform to the way racial identification "is commonly reported in government data (Census and CPS)."
Fair enough. But Gallup did not opt for the CPS question format. Instead, it breaks the measurement of race into five separate yes-or-no questions asked in sequence:
Next, I am going to read you a list of racial groups. As I read each one, please tell me whether you are -- or are not -- a member of that racial group. You may consider yourself to be a member of more than one racial group. How about -- ?A. White
B. Black or African-American
C. Asian
D. American Indian
E. Native Hawaiian or Pacific Islander
Why would Gallup deviate from the CPS format? Jones argued that the yes-or-no format "lines up better to the way they report racial categories than the 'choose one race' approach we used in the past and most other firms use."
There’s some debate about whether yes-or-no questions are the best way to measure race in polls, but the bigger issue here is the difference between the Gallup and CPS question formats -- particularly in light of the importance of weighting data to match the CPS numbers.
In this context, the problem with Gallup's yes-or-no format is that it induces more respondents to say they are a member of more than one racial group than the CPS format does.
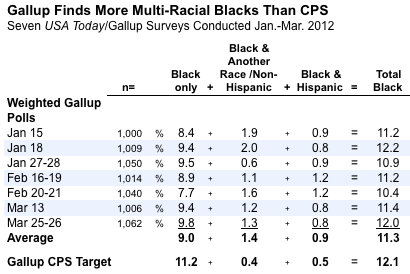
HuffPost's analysis found that the average number of non-Hispanic adults naming more than one race (2.8 percent) in seven USA Today/Gallup data sets was nearly three times the number who identify as multiracial on the CPS benchmark for telephone households (1.0 percent).[1]
This difference has an important consequence because Gallup weights its data to match the percentage from the CPS surveys who say yes when asked if they are black.[2] We do not know precisely how many additional respondents classify themselves as black because of the different format, but we do know that once the Gallup data are weighted, a greater share of its respondents are both black and another race. HuffPost's analysis found that an average of 1.4 percent of respondents on seven USA Today/Gallup surveys said they are both black and another race (but not Hispanic), compared to just 0.4 percent on the CPS benchmark.
In effect, Gallup is not weighting its black respondents as heavily as it should because it has used a slightly broader filter that gives it a higher percentage of "black" respondents to start with. The net difference for overall black composition is very small -- likely less than one percentage point -- but it makes Gallup's weighted samples slightly less black than they appear. Standing alone, this difference might not be significant or even noticeable, but it begins to matter more when combined with other factors.
MISSING THEIR MARK
Taking a sample of a thousand or more Americans and weighting it to represent the entire population is more than a matter of simple multiplication. Pollsters like Gallup attempt to balance a number of variables at the same time -- race and Hispanic ancestry, gender, age, education, region, number of adults in the household and telephone usage (mobile or landline).
A common method for weighting by multiple variables, called "raking," involves weighting the data by one variable at a time, in sequence and repeating as necessary, until the weighted percentages for the various demographics match their targets (or come reasonably close). It's akin to a golfer manicuring a sand trap after hitting a ball out of the hazard. First you even out the sand in one direction -- but doing so disturbs the sand around it. So next you even out the sand in another direction, and repeat, until you're left with a smooth surface.
Trying to balance a large number of demographic variables can produce some very large adjustments, so polling firms typically trim the weights so that no respondents are weighted up too much or down too little. Weighting up too much can create a small number of very heavily weighted respondents who have too great an influence on the results, especially in some smaller subgroups.
"When we weight by the different variables, the actual weighted percentage of a particular group could be pulled off a bit once all weighting is done," Gallup's Jones explained. "We have maximum deviations we will allow a group to be off by and will re-weight if necessary so all groups are in line."
As it turns out, Gallup's weighting often falls short when it comes to hitting the targets for race and Hispanic ancestry. With the assistance of Dartmouth University political scientist Brendan Nyhan, we examined the raw data for seven Gallup surveys sponsored by USA Today and conducted from January to March 2012. Gallup routinely deposits its raw data from surveys sponsored by USA Today with the Roper Center for Public Opinion Research, which provides access to its archives to scholars at member institutions. Except when USA Today runs questions on the Gallup Daily tracking poll -- which occurred for five of the seven data sets we examined -- Gallup does not share raw data from that massive tracking poll with the Roper Center.
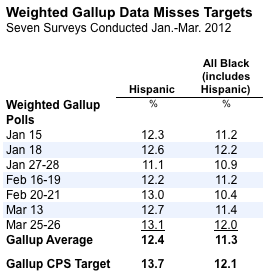
All seven surveys based their weighting targets on the March 2011 CPS (filtered for adults in telephone households). However, when we applied the actual weights used by Gallup (provided in the raw data files), the weighted values for black and Hispanic identification fell slightly short of those targets in all but one instance. The weighted Hispanic percentage fell below the target in all seven cases.
The misses were typically small -- usually within a single percentage point, although sometimes slightly bigger -- but they made a consistent impact on the non-white composition of Gallup's samples. Instead of achieving the target of 12.1 percent black set by the March 2011 CPS, the average across the seven surveys was 11.3 percent black. Instead of hitting the CPS target of 13.7 percent Hispanic, the seven surveys averaged just 12.4 percent Hispanic.
Why the shortfall? According to Jones, it is a consequence of trimming the weights. "In practice," he explained, "the weighted [percentages] pretty consistently come a bit below the target for hard-to-reach groups, such as blacks, Hispanics, young, low education, etc."
Gallup's statisticians must make a "trade-off," Jones added, that involves balancing "a lower range of weights but perhaps come up a little short of the target vs. a higher range of weights including some very large weights to a few cases [and] getting closer to the target. If we find after our standard trimming approach we are not close enough to the targets, we'll make some minor adjustments to the weights until we get close enough to the targets."
That may be, but there is more than just the weight trimming issue at work. Considered alone, any one of the three issues raised here -- the weighting targets set by Gallup, the different question format used to ask about race and the failure of the weight targets to hit their mark -- would probably not make enough difference to affect the results for questions about presidential job approval or vote preference. But a focus on all three issues combined does help explain differences in the results among various pollsters.
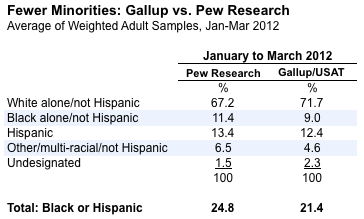
Consider the contrast in race as measured by Gallup and the Pew Research Center. Both use the March 2011 CPS to set weighting targets. Both ask race questions that allow respondents to select more than one race. But unlike Gallup, Pew Research models its race question on the CPS format and weights to match the CPS benchmark for all adults rather than adults in telephone households.
If we compute the available data for race and Hispanic origin for both organizations using apples-to-apples categories, the combined black-or-Hispanic composition of the Pew Research polls is nearly three-and-a-half percentage points greater (24.8 percent) than the average composition of the seven USA Today/Gallup surveys conducted over the same time period (21.4 percent).[3]
That variation alone is enough to explain the typical difference between the two organizations' measurements of President Obama's job approval. If we recalculate the Obama job rating for the seven USA Today/Gallup surveys based on a racial composition that matches the Pew Research surveys conducted over the same period, the evident house effect differentiating the two pollsters on Obama job approval is largely erased.
"The decisions to align a national telephone survey to something other than national telephone Census targets or to trim weights are judgment calls," Gallup's Newport told HuffPost, "and there are reasons that would argue for and against taking both courses of action, one of which could be the possibility that one course of action may produce slightly higher percentages of minorities in the weighted sample. Our methodologists certainly take into account all the pros and cons of the various decisions involved in sample weighting."
"We are constantly reviewing our procedures and making the best, well-informed judgments on changes," Newport said.
THE NEW REALITY
To be fair, Gallup is an easy target for this sort of analysis. Its admirable commitment to transparency -- specifically its willingness to share raw data with the Roper Center archives and to respond to every question asked -- made this article possible.
Gallup is also far from the only pollster to demonstrate house effects on presidential job approval or vote preference results. Other firms using different methodologies routinely produce house effects as large or larger, deviate far more from the Census question formats or weight their "likely voter" samples directly, based on what amount to educated guesses about the demographics of the likely electorate. The worst offenders rarely disclose anywhere near as much raw data or as much detail about their methods as Gallup does.
The real story here is less about Gallup than about the new reality of public opinion polling. Sophisticated random samples, live interviews and rigorous calling procedures alone can no longer guarantee accurate results. Today's rapidly declining response rates require more weighting than ever before to correct demographic skews, a phenomenon that places growing stress on previously reliable weighting procedures.
In that context, the accepted standards for disclosure leave those who scrutinize polls in the dark. Survey firms routinely publish details such as polling dates, sample size and margin of error, but are less apt to share details about weighting. Many withhold the weighted demographic compositions of their adult samples, their "likely voter" samples or both, and few disclose their unweighted demographics or the severity of weighting required. Gallup releases the raw data for some of its polls -- but only months after its original release of results and only to scholars at institutions that pay for access to the Roper Center archives. Gallup keeps most of the data for its massive daily tracking poll closely guarded.
If politicians, journalists and the general public want to understand why some pollsters' results differ from others', the standards for disclosure must change.
In an era when a poll is only as accurate as the procedures used to adjust its sample, and given the omnipresence of Gallup's daily tracking poll in the coverage of campaign 2012, we need to know more.
- Footnotes:
Much like Elizabeth Warren, whose bid for the U.S. Senate in Massachusetts has faced controversy over her claims to minority status based on a distant Native American ancestor, a certain number of respondents who would identify only as white on the CPS question also say yes to "American Indian" on the Gallup questions. According to Gallup's Jeff Jones, the firm consistently finds 8 to 10 percent who say yes, most of whom also identify as white. That compares to 1.5 percent of adults who identify as "American Indian" on the CPS. Gallup opts to ignore the "American Indian" question in its weighting procedure and, for the purposes of cross-tabulations, classifies those who say they are white, Native American and nothing else as white. ↩