
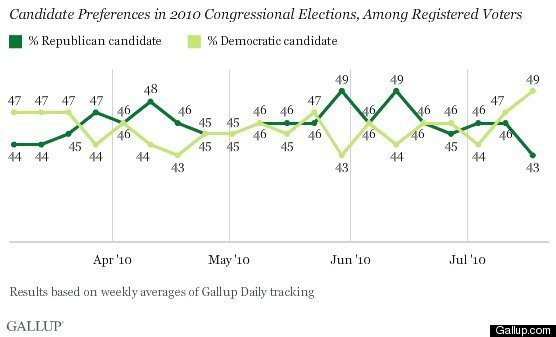
On Monday, Gallup released the latest update in its weekly tracking of “generic” ballot preferences for the 2010 Congressional elections. The generic ballot asks voters if they would vote for “the Democratic Party’s candidate or the Republican Party’s candidate” in their congressional district, if the election were held today.
According to the analysis by Gallup’s Lydia Saad, this week’s showed “the first statistically significant lead” for the Democrats (49% to 43%), since Gallup began weekly tracking in March, so naturally the headline read: “Democrats Jump Into Six-Point Lead.”
Analysts and pundits wasted no time offering possible explanations for the “jump.” Saad’s lead sentence juxtaposed the news of the Democrats pulling ahead with passage of “a major financial reform bill touted as reining in Wall Street.” Elsewhere, Kevin Drum, Tom Schaller and Andrew Sullivan offered alternative theories, although all also cautioned that the pattern could be an “outlier” or “blip.”
Let me play the cautious pollster for a moment and make the case for “blip.”
Yes, this week’s reported six-point lead for the Democrats is statistically significant, but the bigger issue is whether it is significantly different from Gallup’s reading in previous weeks. Remember, all polls have random variation built in that we usually think about as the “margin of error.” Random up-and-down variation within that range is to be expected.
The chart below plots the percentage of respondents each week who tell Gallup they are voting for a Democrat (the blue dots) plus a vertical (blue) line for each poll that indicates the range associated with the reported +/- 3 margin of sampling error.
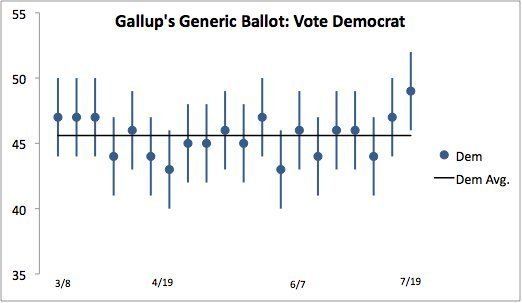
I have also added a black line showing the average Democratic vote (45.6%) over the full 20 weeks of Gallup tracking. The total lack of a trend is hypothetical, since we do not know for certain that the “true” support for Democrats has been an absolutely flat line since March. I’m plotting that line, however, in order to ask a question: Has this week’s poll, or any poll in the series for that matter, produced a result inconsistent with the average? In other words, does any result fall outside the range of 45.6%, plus or minus 3%? The answer is, just one — this week’s — and just barely. This week’s result (49% Democrat) minus three (46%) is just four tenths of a percentage point greater than the average (45.6%). Keep in mind that each week’s result, and the reported margin of error, have both been rounded to the nearest whole digit, so it’s possible that if we had all data calculated to one decimal, we might reach a different conclusion.
And keep something else in mind about the margin of error: It represents a probability. We can expect results to fall beyond the margin of error 5% of the time, or for one measurement out of twenty (that’s the idea behind the line in Gallup’s methodological blurb: “one can say with 95% confidence that the maximum margin of sampling error is ±3 percentage points”).
Guess what? Gallup has released exactly 20 results so far in its weekly tracking series and exactly one — this week — has fallen outside the average of all the polls combined (and then by just 0.4%).
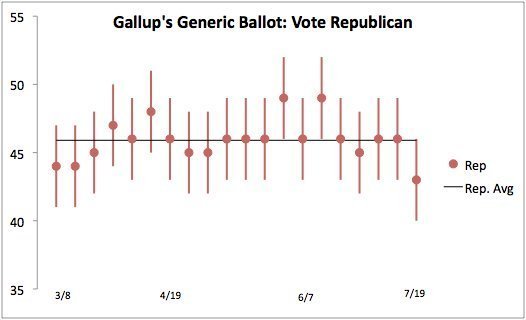
Now let’s look at the same chart for the percentage voting Republican as compared to a flat line average of 45.9% Republican across all twenty weeks of Gallup’s tracking. In this case, this week’s result (43%) plus three (46%) captures the average for all 20 weeks (45.9%) by just one tenth of one percent. However, two polls conducted six and eight weeks ago fall (each showing Republican preference at 49%) fall just outside the range.
Thus, the case for true “jump” in Democratic performance on the generic House ballot is weak. If we add the context of other recent polls, it gets weaker still. Their results scatter around a dead-heat margin in ways that are more or less consistent with their typical house effects on the generic ballot.
As always, more data next week will likely settle the issue, but I wouldn’t be surprised to see the next move in Gallup’s weekly tracking in the Republican direction, not because of real-world events but rather due to what statisticians call a reversion to the mean.
P.S.: Jay Cost has similar thoughts on Gallup’s “Bouncing Ball.”