Asthma is a nationwide epidemic, but the impact is perhaps felt most strongly in Alameda County where the asthma hospitalization rate is 20.3 per 10,000 children -- almost twice the state average.
The Oakland Tribune issued a special investigative series on asthma in the Bay Area, specifically in Oakland, CA. Their interactive map shows some neighborhoods in the area experience even higher rates, like Emeryville at 72.3 per 10,000 children and the port areas of West Oakland at 64.7 per 10,000 children.
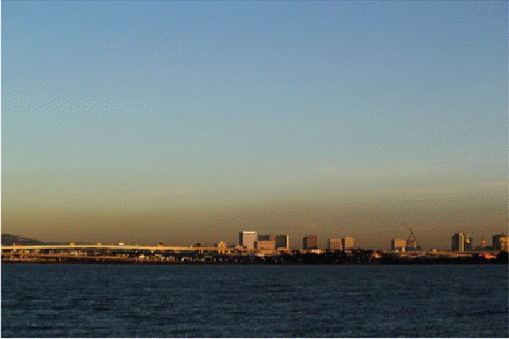
These disparities in hospitalization rates are likely caused by a combination of factors: access to primary care, socioeconomic status, zoning and transportation patterns, housing quality and geographic variation. Of particular concern, however, is the area's long history of environmental pollution from waterfront industries, trucking and traffic.
Photo credit: Jose C Silva (Creative Commons License)
We're gaining incredible insight into air quality and pollution on a local level. The West Oakland Environmental Indicators Project, for example, uses activism and leadership training to collect, analyze and organize around local air quality measurements in their community. Meanwhile the East Bay Academy of Young Scientists program found particularly high levels of particulate matter in the San Francisco BART stations.
Even still, our knowledge of asthma is largely restricted to hospitalization and emergency department visit data released on a monthly or yearly basis. And by then, it's too late.
Given that the Bay Area boasts an ever-expanding health technology scene, we have to ask ourselves: Why aren't we doing better at gathering real-time, place-based health data?
The fields of geomedicine, spatial epidemiology and health geography have already been digging in to figure out how place affects our health. By mapping clusters of disease over age, race, income, education and other characteristics, we can begin to understand these relationships, like John Snow did back in 1854 with his analog mapping of a massive cholera outbreak in London linked to contaminated drinking water.
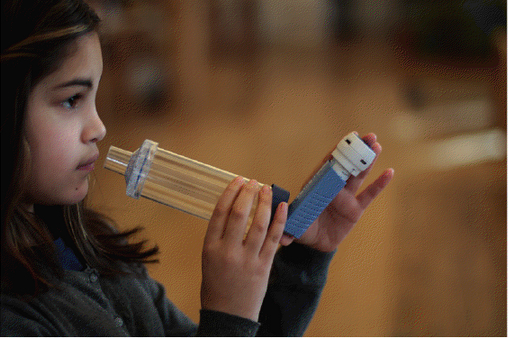
South by Southwest (SXSW) just featured a number of panels on the use of GPS-enabled sensors and mobile apps to help individuals, clinicians and public health researchers better understand what's happening in real time and space. One panel featured Asthmapolis, which has designed sensors that snap onto asthma inhalers and track the time and location of asthma symptoms, which could then be tied to environmental triggers such as air pollution.
Photo credit: Asthmapolis
But data doesn't become information until someone does something with it. We believe sustaining an active conversation around asthma and environmental justice is critical to reducing the burden of asthma. The Oakland Tribune will be hosting a public forum on March 20, "Asthma -- The Battle to Breath," to highlight the current work that's being done to tackle asthma in the Bay Area. It's free -- just RSVP for the forum here.
Let's harness the power of digital health to make a better asthma map for the children of Oakland and the entire Bay Area. The result? More effective treatment, policies, community interventions -- and more kids with asthma-free days.
Meredith Barrett, PhD, is a Robert Wood Johnson Foundation Health & Society Scholar at UC San Francisco and UC Berkeley School of Public Health (and research collaborator withAsthmapolis).
Justine Marcus is the Community Manager and Research Associate at Asthmapolis. Her interests lie at the intersection of public health, environmental justice, smart urban and transportation planning, and community organizing.