

New National Data From 21 States Shows Hate Crime Up
Our recent 20-state study, released last month, and to be presented at the American Society of Criminology next month, found small overall hate crime increases punctuated by significant spikes that vary by location, offense type, significant event dates and targeted group. The data relied primarily and preferably on official law enforcement figures.
Since the report was published we have new official police data from Maryland, one of the nation's most diverse states, with one of the highest percentages of Jews, Muslims and African-Americans. Maryland was also the first state in the nation to systematically record hate crime statistics. This updated 21-state data is presented for the first time here in The Huffington Post. Final national hate crime figures from the FBI are expected late next month.
Twenty One U.S. State Annual Change by Group For 2015 : Update of Special Status Report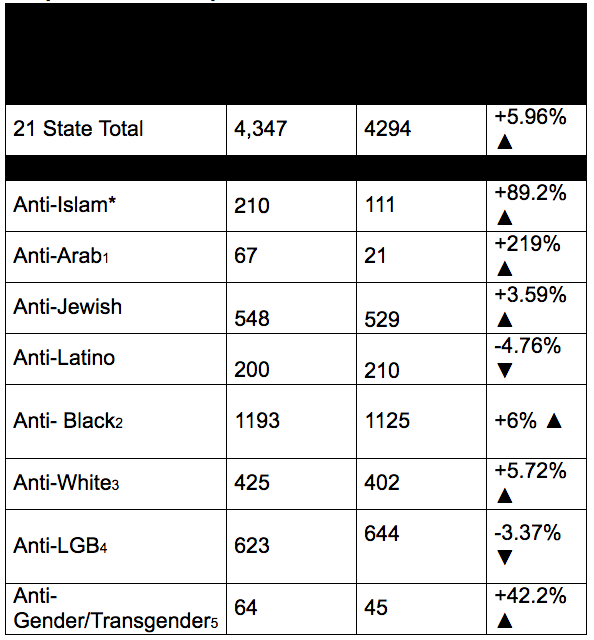
1. Due to limited availability of data, the analysis of Anti-Arab hate crimes in the U.S. only includes 10 U.S. states. The limited availability of the data is due to this being a new hate crime data category by the FBI and in many areas of the U.S.
2. The analysis of Anti-Black hate crimes in the U.S were drawn from a sample of 12 larger U.S. states that had at least 100 or more incidents in at least one of the last two years.
3. The sample of data used for analyzing anti-White hate crimes was only the 12 larger U.S. states referenced above.
4. Similar to anti-Black and anti-White hate crime data, this sample only included 12 larger U.S. states.
5. Due to this being a newer category, the analysis of gender/transgender hate crimes was only drawn from 9 U.S. states.
* Since report published updated data for 21 states and partial DC data show an increase in anti-Muslim hate crime from 114 to 213 in 2015 for an increase of 86.8%. Full Sept. Report Available.
Anti-Muslim Hate Crimes Soar to Post-2001 Record, But Jews Targeted More
Overall small increases hid significant spikes in bias crimes against Muslims, Arabs and transgender people in 2015, with hate crimes against Muslims rising 89 percent, statistically breaking out of range of between 105 and 160 in the years since 9/11. In our 21-state sample of official law enforcement data there were 210 anti-Muslim hate crimes, which we cautiously expect to rise up to 280 nationwide when the FBI releases its data next month. Because the District of Columbia only sent partial overall data, we did not include three anti-Muslim hate crimes reported there in our tally. Applying the overall increase of 5.96 percent in 2015 found in the 21 states we surveyed to last year's FBI total of 5,479 incidents, we expect the final official FBI data total to be around 5,806, although we urge caution for our extrapolated estimates.
Jews, however, are still by far the most frequent target of religious hate crime, constituting 548 incidents or 12.6 percent of all hate crime in our sample, but anti-Jewish crimes have been in a period of overall decline -- about 40 percent over the last decade, despite a 3.6 percent increase in our sample for last year. Nonetheless, the Anti-Defamation League, a Jewish civil rights group, in a prior report found a disturbing increase in 2015 in assaults as well as campus incidents. Still, the precipitous increase in Muslim hate crimes, for such a small group, about one percent of the population, resulted in Muslims not only increasing in the aggregate, but as a proportion of hate crime targets, up from 2.66 percent in 2014 of all hate crime to 4.83 percent in 2015 in our 21-state study.
What's Behind the Increase in Anti-Muslim Hate Crime?
What is behind the spike in anti-Muslim hate crimes? While the data is not as diagnostic or predictive as some would suggest, we can at least isolate certain relevant developments that took place during this period where attitudes were possibly impacted. These include elevated levels of prejudice and fear directed against Muslims domestically, highly publicized terror attacks and bigoted pronouncements by violent Salafist Jihadist extremists directed at Americans and Europeans, and the coalescence of populist socio-political movements in the West that lean toward Euro-Nationalist identity and away from greater international engagement in such things as existing trade agreements to immigration.
As a series of violent escalating Salafist jihadist terrorist attacks and plots hit Europe, and the United States, a brutal civil war reverberated beyond Syria's borders last year. Horrendous pronouncements and videos by Daesh or ISIS, a group overwhelmingly rejected by Muslims in international social surveys, were widely publicized in the United States. The comprehensive and controversial nuclear agreement with Iran in July 2015, as well as its incarceration of an American reporter and others also garnered headlines. As the election season commenced, immigration and national security often took center stage, with discourse frequently shifting towards Muslims collectively, and often, regrettably, with the invocation of incendiary negative stereotypes. These stereotypes help amplify where prejudice is directed communally within various subgroups, where certain out groups are negatively characterized. Stereotypes are over-generalizations, usually negative, about a group; that people respond to across a range of behaviors going from degradation and social isolation to aggression.
With respect to Muslims, however, prejudice has been elevated for the better part of a decade. Muslims have been either the most negatively viewed, or among the top few socially recognized groups that are negatively categorized, with the most recent study released in August's Social Forces journal having them top that list. In 2014, before the current election season, Pew research also found that Muslims were the least positively viewed religious groups.
Ignorance about the Islamic faith and its heterogeneity, coupled with a lack of meaningful interaction with peaceful Muslim neighbors, allows publicity about real events and the significant threat posed by a minority of violent fanatical extremists to skew attitudes towards Muslim-Americans as a whole. Economists call this phenomenon availability and unfamiliar event heuristics, where misperceptions and fears about the risk, frequency and causes of events come to frame an inaccurate understanding of them and their context. In this time of sustained heightened prejudice against Muslims, spikes in hate crimes can accompany catalytic events, like terrorist attacks. The phenomenon of catalytic events being followed by additional increases in hate crimes has been documented for decades and includes such incidents as the Rodney King beating case, state court verdicts, and the 9/11 attacks.
Is there a Trump or Bush Effect?
More specifically, our research found that well-publicized statements by political leaders after terrorist attacks were also followed by dramatic shifts in reported hate crimes. Data from the FBI's National Incident-Based Reporting System, collected by Center board member James Nolan, revealed that for the 22 jurisdictions participating there were 77 anti-Muslim hate crimes for the six days from September 12 (none were registered for September 11) through September 17, 2001; the day of the President George W. Bush's mosque address on tolerance, including 15 on that day.
For the six days that followed, anti-Muslim hate crimes dipped to 26, dropping down to five on September 18, the day after the president's address. Because we do not know the times of the hate crimes on September 17, 2001, one may want to calculate the data by making the dividing line the day before, thus going from September 12 through the September 16, for a total of 62, and shifting the 15 over into a new cadre of incidents going until September 21, for a total of 33. If we choose the first data set, the decline for the days after President Bush's speech the drop is 66.2 percent, and if we choose the second set, the declines are still steep, at 46.7 percent.
In contrast, five days after the December 2, 2015 San Bernardino terrorist attack Republican Candidate Donald Trump tweeted an announcement of a proposed ban on all Muslims entering the United States at 1:47 p.m. ET and reiterated his position during a lengthy speech at a rally in the evening, all of which received extensive media attention. The San Bernardino terrorist attack occurred at about 11 a.m. PT, on December 2, but the names of the suspects were not initially released, and suspicions of an indirect connection to ISIS were not definitively confirmed in the media until December 4. For the five days from December 2 through December 6, there were 8 anti-Muslim hate crimes, with none on December 2. For the five days from December 7 through December 11, there were 15 anti-Muslim hate crimes, an 87.5 percent increase with those occurring on December 7 taking place after the announcement. These crimes include multiple assaults and two fire-bombings, including one in the overnight hours immediately following Mr. Trump's announcement. In total there were 45 anti-Muslim hate crimes from November 13, 2015 (the day of the Paris terror attacks) through December 13, 2015. The monthly average for the previous five years is 12.6. This correlation will be heavily researched by our Center in the months to come. For this analysis our Center used official and unofficial data we collected on our own applying FBI and model penal code standards to replicate as close as possible national reporting standards under the supervision of former municipal and federal law enforcement with vast experience in hate crime data collection.
Hate Crimes in the United States In 5 Day Intervals Following San Bernardino Terrorist Attack of December 2, 2015
12/2 No hate crimes
1. 12/3 Palm Beach, FL All windows smashed at Mosque Criminal Mischief
2. 12/3 Hawthorne, CA Islamic school threat to shoot everyone there, Threat
3. 12/3 Grand Forks, ND Somali restaurant vandalized with Nazi slogans, Crim. Mischief (firebombed on 12/8)*
4. 12/5 Astoria, NY Store owner beaten Assault, Threat
5. 12/5 Washington, DC Muslim Cong. Carson death threat, Threat
6. 12/6 Buena Park, CA Sikh Temple Vandalism, Crim. Mischief
7. 12/6 West Philadelphia, PA Pigs head, Crim. Mischief/Threat
8. 12/6 Alameda County., CA Hot coffee attack, slurs Assault
12/6 President Obama Address to the Nation, evening
12/7 Candidate Trump Tweets Announcement re: Muslim Ban/ Speaks at rally
1. 12/7 New York, NY Restaurant worker slapped Assault, Att. Crim. Mischief
2. 12/7 Washington, DC Indiana Cong. Andre Carson death threat Threat
3. 12/8 Jersey City, NJ Threat letter Threat
4. 12/8 Grand Forks, ND Arson, Nazi spray paint Arson, Criminal Mischief* (Arson occurred days after spray paint, so 2 incidents, but one before 12/7)
5. 12/8 Plano, TX New Muslim residents home struck by rocks, Criminal Mischief
6. 12/9 Plano, TX Muslim family home struck again with rocks, Criminal Mischief
7. 12/9 Seattle, WA Ride share driver attacked Assault
8. 12/9 Brooklyn, NY Woman kicked, slurs Assault
9. 12/9 Brooklyn, NY Train Graffiti "Burn Muslims/Heil Hitler," Vandalism
10. 12/10 Queens, NY Sarker Haque attacker yells "I Kill Muslims" Assault
11. 12/10 Washington, DC CAIR gets letter w/powder Threat
12. 12/10 Santa Clara, CA CAIR gets letter w/powder Threat
13/14. 12/10 Tampa, FL Rocks/shots at 2 Muslim drivers Assault, Threat
leaving religious. service in hijab in separate locations
15. 12/11 Coachella, CA Mosque Firebomb Arson
NYC 2016 Year to Date: Hate Crime Up Over Same Period in 2015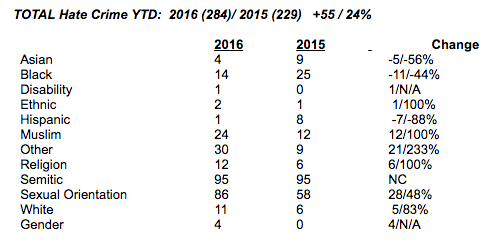
NYPD statistics released to our Center revealed that year-to-date 2016 (through October 16), there was a 24 percent increase in hate crimes overall in the city. These criminal incidents rose from 229 for the period in 2015, to 284 so far in 2016. Anti-Muslim hate crime doubled during that period. New York City anti-Muslim hate crimes for the year to date period rose from 12 in 2015 to 24 so far this year; while anti-gay crimes rose from 58 to 86, a 48.3 percent increase. Anti-Semitic crimes are unchanged so far this year, at 95. Anti-Asian, Anti-African-American, and Anti-Latinos hate crimes all fell sharply so far in 2016.
Interestingly, the large spike seen in 2015 for anti-Muslim hate crime for much of the rest of the country, was delayed until 2016 for New York City. Anti-Muslim hate crime dropped by a single incident or 4.4 percent in the city during 2015, while partial national data of 21 states saw anti-Muslim hate crimes rise by 89 percent that year.
New York City, however, is one of only a handful of jurisdictions with 2016 hate crime data. In contrast to the hate crime increase in the city, an index of all major (primarily non-hate crime) felonies in the city declined 3.06 percent year to date through (October 2, 2016) in comparison with 2015. If current trends continue at the same rate New York City will see 350 hate crimes in the metropolis in 2016, for an overall increase of 13.3 percent with a more pronounced rise in anti-Muslim hate crime of 31.8 percent or 29 incidents. It's simply too early to draw broad conclusions from one large city. As we get more data in, we'll be able to determine whether New York's increases are representative, but large diverse jurisdictions are not always. In 2015, California, for example, showed both much larger overall increases than the national average, as well as significant increases not only against Muslims, but large increases in anti-Latino and anti-Semitic incidents that were not replicated across our total sample.
According to the Census Bureau, New York City is one of the most diverse jurisdictions in the nation, with 33 percent non-Hispanic whites, 29 percent Latino, 26 percent African-American and 13 percent Asian residents. Jews account for 1.1 million of New York City's 8.5 million residents and 13 percent of all Jews in America live there according to Pew Research. The city is 59 percent Christian, 33 percent Catholic; 3 percent Muslim and 3 percent Hindu according to Pew.
2015 Hate Crime Data for City and State 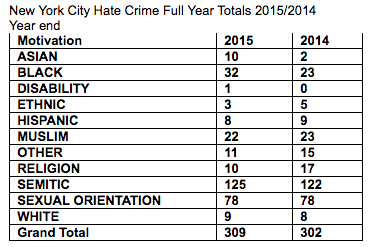
New York City saw a slight decline of 2.3 percent, with incidents dropping from 309 in 2014, to 302 last year. New York State as a whole continued a multi-year decline in hate crime in 2015, with an even larger drop of 9.9 percent. New York City accounted for 61 percent of the state's hate crime in 2015. New York City suburbs of Long Island and Westchester accounted for another 23.5 percent of the state's hate crime in 2015.
Brooklyn, the city's most populous borough with 2,636,735 residents, led the city in hate crimes with 117 in 2015 or 23 percent of the state's total and over 35 percent of the city's total, followed by Manhattan with 104 according to the NYPD. New York State is home to the largest number of Jews, 1.759 million; and the highest percentage of Jewish residents at 8.9 percent of any state in the union. Statewide there was a continued multiyear decline in anti-Semitic the crimes. For 2015 anti-Jewish crimes dropped in the state 12.6 percent from 235 to 206 for 2015 over 2014; while anti-Muslim crime rose 37.5 percent from 24 to 33 incidents. These changes are a decline in contrast to our national data. Even so Jews remain the most targeted faith group for hate crime both nationally and in New York, which is home to 25 percent of the nation's Jews. The overall increase for all hate crime in that survey showed an overall increase of 6 percent.
New York City's Hate Crime Task Force is the largest and second oldest of any hate crime unit in the United States, and the city began collecting data in 1980.
U.S. Census: New York City Population By Year and Most Prevalent Race/Ethnicity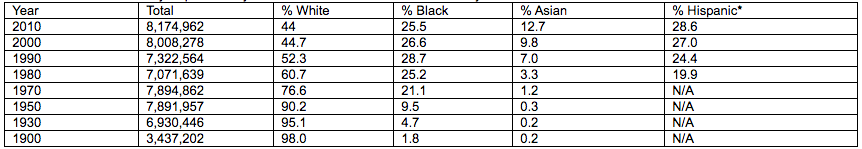
*Census Data on Hispanics not systematically broken out until later decades. Hispanics can be of any race and thus not part of racial total percentages. Other races not included in table.
New York City Hate Crime By Year
2016 284 (Year to Date: NYPD)/ 350 (Center Year End Projection/Est.)
2015 309
2014 302
2013 314
2012 372
2011 240
2010 348
2009 271
2008 258
2007 295
2006 274
Source: NYPD Hate Crime Task Force/Deputy Commissioner of Public Information (2014-2016); Federal Bureau of Invesitgation (2006-2013).