Over the last 40 years, obesity rates around the world have ballooned. The average adult today is three times as likely to be obese as the average adult in 1975.
This map shows how it happened, country-by-country.
Each country's color corresponds to its adult obesity rate in the year shown.
The data for this map comes from an extensive study published earlier this year in The Lancet.
The researchers compiled data from 1,698 obesity-related studies, covering 19.2 million people in 186 countries. They then used the information to estimate the distribution of body mass index (BMI) for every country in the world, for every year from 1975 to 2014.
Between 1975 and 2014, the study estimates that worldwide age-standardized obesity rates (defined as a BMI of 30 or greater) increased from 3.2% to 10.8% for men, and from 6.4% to 14.9% for women.
Put another way, there were 105 million obese adults worldwide in 1975. As of 2014, that number has risen to 641 million, as shown in the chart below (during the same period the world population increased from 4 billion to 7.2 billion).

The rise of obesity (credit: Trends in adult body-mass index in 200 countries from 1975 to 2014)
The researcher also estimate that 2.3% of the world's men and 5% of the world's women are severely obese. In 1975, the rate of severe obesity for both genders was just a fraction of 1%.
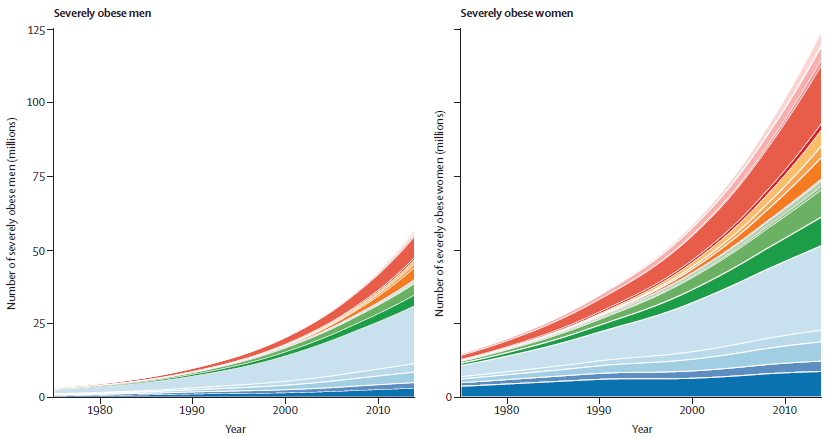
The rise of severe obesity (credit: Trends in adult body-mass index in 200 countries from 1975 to 2014)
Obesity by country and gender
The chart below shows the age standardized obesity rates in 2014, broken down by country and gender. It includes all countries with a population of 10 million or greater.
It's interesting to notice how much difference there can be between male and female obesity depending on the country.
In the United States, obesity rates for men and women are roughly equal, 34% and 35% respectively. In contrast, Egypt, Turkey, and South Africa have higher rates of female obesity than the U.S. But their obesity rates for males are 13% to 19% lower than the U.S.

The study also makes a prediction of what global obesity may look like in the future.
If the post-2000 trends continue, by 2025, it projects a worldwide obesity rate of 18% for men and 21% for women. Of those, it estimates 6% of men and 9% of women will be severely obese.
For a related map showing the rise of obesity in the U.S. state-by-state, see: Crazy American Obesity in 4 Graphics
- Obesity-related data comes from Trends in adult body-mass index in 200 countries from 1975 to 2014, downloadable in tabular format from ncdrisc.org. Population estimates and gender ratios come from World Bank Open Data.
- The figures visualized in the map are the average of the male and female obesity rates, weighted by each country's gender ratio.
This post originally appeared on Metrocosm