High frequency trading has been taking Wall Street by storm. While no institution thoroughly tracks performance of high-frequency funds as of the date this article is written, colloquial evidence suggests that the majority of high-frequency managers delivered positive returns through the most recent financial crises.
The discourse on what is the profitability of high-frequency trading strategies always runs into the question of availability of performance data on returns realized at different frequencies. Hard data on performance of high-frequency strategies is indeed hard to find. Hedge funds successfully running high-frequency strategies tend to shun the public limelight. Others produce data from questionable sources.
Yet, performance at different frequencies can compared using publicly available data by estimating the maximum potential profitability. Profitability of trading strategies is often measured by Sharpe ratios, a risk-adjusted return metric first proposed by a Nobel Prize winner, William Sharpe. A Sharpe ratio measures return per unit of risk; a Sharpe ratio of 2 means that the average annualized return on the strategy twice exceeds the annualized standard deviation of strategy returns: if the annualized return of a strategy is 12%, the standard deviation of returns is 6%. The Sharpe ratio further implies the distribution of returns: statistically, in 95% of cases, the annual returns are likely stay within 2 standard deviations from the average. In other words, in any given year, the strategy of Sharpe ratio of 2 and annualized return of 12% is expected to generate returns from 0% to 24% with 95% statistical confidence, or 95% of time.
The maximum possible Sharpe ratio for a given trading frequency is computed as a sample period's average range (High - Low) divided by the sample period's standard deviation of the range, adjusted by square root of the number of observations in a year. Note that high-frequency strategies normally do not carry overnight positions, and, therefore, do not incur the overnight carry cost often proxied by the risk-free rate in Sharpe ratios of longer-term investments.
Table 1 compares the maximum Sharpe Ratios that could be attained at 10-second, 1-minute, 10-minute, 1-hour and 1-day frequencies in EUR/USD. The results are computed ex-post with perfect 20/20 hindsight on the data for 30 trading days from March 11, 2009 through March 22, 2009. The return is calculated as the maximum return attainable during the observation period within each interval at different frequencies. Thus, the average 10-second return is calculated as the average of ranges (high-low) of EUR/USD prices in all 10-second intervals from March 11, 2009, through March 22, 2009. The standard deviation is then calculated as the standard deviation of all price ranges at a given frequency within the sample.
Table 1. Theoretical Performance Limits for Trading Strategies Running at Different Frequencies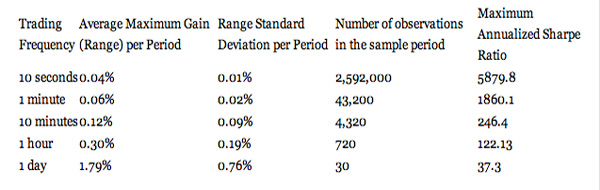
As Table 1 shows, the maximum profitability of trading strategies measured using Sharpe ratios increases with increases in trading frequencies. From March 11, 2009, through March 22, 2009, the maximum possible annualized Sharpe ratio for EUR/USD trading strategies with daily position rebalancing was 37.3, while EUR/USD trading strategies that held positions for 10 seconds could potentially score Sharpe ratios well over 5,000 (five thousand) mark.
In practice, well-designed and implemented strategies trading at the highest frequencies tend to produce double-digit Sharpe ratios. Real-life Sharpe ratios for well-executed daily strategies tend to fall in the 1-2 range.