
 How does Hurricane compare in severity with Hurricane Irene? Eqecat has estimated likely insured losses from Sandy of up to $10 billion, which is less than was predicted. It implies a loss of close to $20 billion, based on the rule of thumb that insured losses are half total losses.
Last year, Hurricane Irene was billed as the fifth most costly U.S. hurricane, comparing 2011 loss figures with losses dating back to 1900 and not adjusted for inflation. This rank was bogus. Irene was not even among the 10 most costly. Reuters now suggests Hurricane Sandy will be the 5th most costly. Premature, but possible.
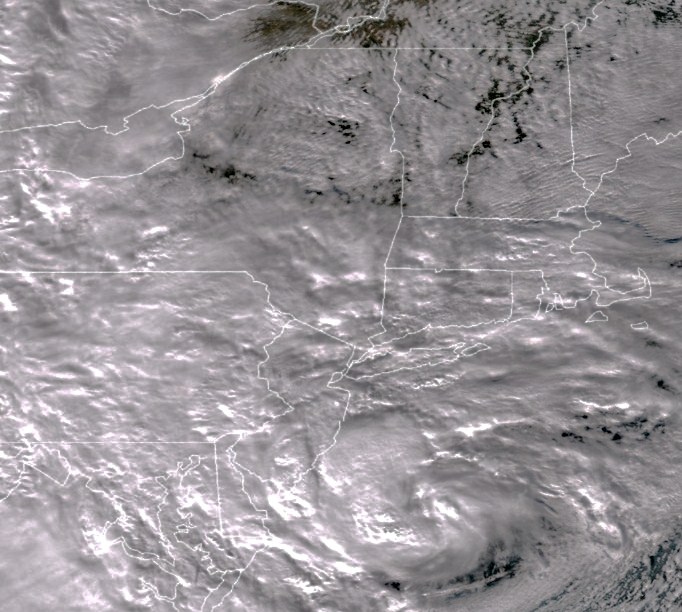
Hurricane Sandy heads for New Jersey,
October 29, 2012. Satellite photo by NASA/NOAA.
Statements from public officials suggest that the loss from Hurricane Sandy is likely to be greater than this. Property damage is most extensive along the shore, where values are high. Salt water damage is serious for vehicles and equipment. Damage to railway and power equipment is huge. New York and New Jersey together have a $1.7 trillion annual product, $33 billion per week. If transportation and power supply problems continue to be widespread into a second week, business-interruption costs to employers and employees will approach the $20 billion mark.
Comparisons with Hurricane Irene
Last year I examined the claim that Hurricane Irene was the fifth-costliest U.S. hurricane. Upon examination, Hurricane Irene does not even rank among the 10 most costly. A dollar ranking that does not adjust for inflation is just not useful.
The New Jersey and New York City flood damage greatly exceeds that of Hurricane Irene. The projection has been made that Hurricane Sandy will be the costliest East Coast hurricane ever:
The significance of an oncoming storm is now estimated by meteorologists based on wind-speed categories and barometric pressure. The two measures are interrelated and point to likely wind speeds. The public needs also an indicator of the likely economic impact of flooding.
1. Five Wind-Speed Categories. A Category 1 hurricane means wind speeds of 74-95 mph on the Saffir/Simpson Hurricane Scale. The categories go up to 5 for wind speeds above 155 mph. Hurricane Irene petered out on its way north. The warm air carried by Hurricane Sandy on its way north met another storm with cold air from the northwest.
2. Millibars -- Barometric Pressure. The Christian Science Monitor has posted a lucid summary of the significance of this measure of hurricane severity. (It also repeats the error cited above about the cost of Hurricane Irene -- I will return to this.) Ordinarily, the barometric pressure is related to wind speed. The normal sea-level barometric pressure is 1013.5. During a hurricane the eye of the storm shows the lowest barometric pressure. The lower the pressure, the higher the winds. During the afternoon before hit landfall,the barometric pressure at its eye fell from 943 to 940, which is a level associated with Category 3 or Category 4 winds. The lowest barometric pressure that has been measured in a hurricane is 882 for Hurricane Wilma. Hurricane Carla was the tenth-lowest, 931. The list of the most intense Atlantic hurricanes does not follow the Millibars ranking exactly, since Katrina and Wilma are not in the order one would expect. Irene is not among these most intense hurricanes. So the prospective readings are not a definitive measure of impact.
3. Storm Surge Impact. Most of the damage from Hurricane Sandy is caused by the delayed impact of the storm surge (the hurricane equivalent of a post-earthquake tsunami). We needa new indicator of likely flood damage, which would have to take into account the economic value of property in the track of the hurricane, the sea level of the land, and the size of the expected surge. The Storm Surge Impact index could take into account the timing of the tides -- Hurricane Sandy hit landfall near high tide and the full moon added to the height of the tide and therefore to the surge. The geography of the surge was important in the case ofNew because the surge came from two directions -- down the coastline through the Long Island Sound and northward through the funnel of .
Retrospective Measures of Cost
There are at least six basic ways to measure or adjust the cost of a hurricane after the fact. They overlap:
1. Loss of Life, or Injury. Every life is precious. That is why good records are kept on fatalities. On the measure of number of lives lost to a hurricane, Hurricane Irene's 24 lives lost did not even rank among the 100 most costly hurricanes. Despite great efforts to prevent fatalities, Hurricane Sandy has taken 48 lives so far. As a measure of the severity of a storm, the indicator is limited because government officials are much better than they used to be at identifying places from which people should be evacuated, and at following up. Mayor Bloomberg has made clear that the overriding priority of the City of NY is to avoid loss of life among residents and emergency workers. The mayor has taken a scientific approach to evacuation based on flood probability maps that use feet above sea level a proximity to water to create three evacuation zones. These maps proved highly predictive. Over the years there has been steady improvement in (a) U.S. Government warning systems via NOAA and its National Weather Service and , and (b) the FEMA network of state notification and assistance. Loss of life can be converted to a dollar figure via life insurance losses or a value that economists impute to a person's remaining working life. Injuries also represent a cost either to the individual or to health insurance plans (private or governmental), and injuries that result in a disability can be attached to a working-life cost. The final number for lives lost from Hurricane Irene appears to be 24. Just one of the deaths was in . The deadliest Atlantic hurricane since 1900 was in , in 1900, with a range of between 8,000 and 12,000 deaths. The fifth-deadliest was the 1938 Long Island Express with 600 deaths. Hurricane Irene did not come close.
2. Loss of Physical Property. Property can be destroyed by wind or flooding or a combination. This means a loss of wealth of the property owner. If the loss is charged against revenue, it means a loss of revenue. (A building may be a depreciated asset; loss of inventory is likely to be expensed.) The first impact may be flying debris, the lifting off of roofs, the flattening of flimsily constructed buildings. The delayed effects include (a) loss of electricity from downed power lines, which means that many perishables have to be thrown out, and (b) flooding, which destroys or rends temporarily useless all kinds of property, such as books and electronics, especially if the flooding is from salt water, which MTA Chairman Joe Lhota and Con Ed Chairman Kevin Burke say is especially damaging to power connections, create huge problems for electricity supply and transportation infrastructure.
3. Business Interruption. The delayed effects of a hurricane also include business interruption. Increasingly, businesses insure not only against loss of property but the loss in profits that comes from an interrupted business. When a restaurant or a theater remains closed because of floods that prevent people from showing up, it is hard to make up the loss because the business space has a limited capacity. That is something not fully taken into account by those who look for a large rebound after a disaster, as might be true of a retail store that offers a post-hurricane sale. Some kinds of losses are much harder to make up. Figures on the cost of hurricanes increasingly include business-interruption losses, which bias upward the later numbers -- another reason it is so important to adjust for inflation as discussed below. It is incorrect to offset the wealth loss from hurricane damage with the economic activity from replacing the loss -- Frederick Bastiat long ago explained why with his "broken window fallacy" analysis.
4. Insured vs. Uninsured Private Losses. Insurance companies are most interested in the total of insured losses. But from an economic perspective, losses to individuals (e.g., workers paid by the hour) are real. The money that would have been spent in the community by the individuals is missing. The uses a simple rule to estimate uninsured losses -- it doubles the number for insured losses.
5. Government Losses. At the national level, flood insurance is provided by the National Flood Insurance Program. Individuals pay a premium for this insurance, which would otherwise not be available. After a hurricane, there will be payouts and a loss that may exceed cumulative premiums. The in its estimate of damage adds in the number for flood damage provided by the National Flood Insurance Program. FEMA programs provide relief to local governments and individuals. Other Federal bodies (the dewatering unit of the Army Corps of Engineers, for example), states (emergency response teams) and localities (police, fire, sanitation, ambulance) must also be factored in as costs of a disaster.
6. Adjustments for Inflation or Growth in Business Activity. Two kinds of adjustments are typically made to comparisons among hurricanes. One is to adjust cost figures for inflation. The Christian Science Monitor story cited above incorrectly describes Hurricane Irene as the fifth mostly costly hurricane in history. As I explained last year, that label only works if we are under the delusion that a dollar 100 years ago should be valued the same as a dollar today. (Apart from the fact that business-interruption costs are increasingly included in hurricane losses, adding to the size of the numbers.) There are widely available cost-of-living indicators to refer to, such as this one from the BLS. Business activity measures are used to relate hurricane damage to the value of the real estate through which the hurricane travels. This is a good predictor of cost and is also a factor to consider in comparing the impact of a hurricane traveling the same path in different years.
Total Economic Damage
The deadliest hurricanes are not always the costliest in terms of property loss or business interruption.
The 10 costliest Atlantic hurricanes are listed below with their estimated damage. Total estimated damage includes insured and uninsured losses. A rule of thumb is that uninsured losses equal insured losses. So if an insurance association or forecaster estimates that insured losses are $10 billion, then total private losses (insured plus uninsured) are commonly doubled (to $20 billion). In addition, losses are borne by Federal, state and local governments - the cost of special national insurance programs like flood insurance, or the cost of FEMA assistance, or the cost to states and localities of the overtime of emergency-assistance personnel or the damage to public infrastructure.
Note that earlier estimates are generally based on physical damage only, whereas later economic impact numbers, after WWII, include impacts such as business-interruption costs because these became widely insured events.
In addition, dollar-value rankings must be adjusted for inflation. There is no sense in unadjusted dollar numbers that go back to 1900. The most costly hurricane ever was the 1926 Miami Hurricane, which cost $165 billion in 2010 dollars according to the .
(2010 dollars)
Hurricane Irene's estimated cost was $15 billion. Clearly, it does not rank among the 10 most costly hurricanes. However, Hurricane Sandy will surely do so. The key is insured losses and government losses. If Hurricane Sandy ends up with insured losses above $15 billion, the economic impact could be as high as $38 billion, ranking #8, between the SW Florida Hurricane of 1944 and the Lake Okeechobee Hurricane of 1928. If insured losses approach $20 billion, the cost of Hurricane Sandy will end up above the 1938 Long Island Express, and would rank #6. If insured losses exceed $25 billion, it could rank ahead of Hurricane Andrew, at #5. These numbers are based on the inter-temporal adjustments made by the National Hurricane Center. The Insurance Information Institute uses lower thresholds, adjusting only for inflation.