
The goal is to find some valuable mathematical objects that look like real things such as continents, animals, etc. Such figures may encourage young people's interest in mathematics. Heart curves are some famous examples of such mathematical objects. Here, I want to talk about two approaches. The first approach is to create some artistic mathematical patterns inspired by the continents. Such patterns show the power of mathematics to create some great connections between art and geography. It is impossible to connect an exact map of a continent with a basic mathematical concept. So, it is very useful to define a polygon that looks like a continent. Some suitable polygons enable us to create some continents-inspired fractals or tessellations. It is not always easy to find a good enough polygon for a continent. For example I still can't find a suitable polygon for Europe or Asia. The following images are some of my works. These are some mathematical objects, but also they can be considered as artworks.
Fractal Africa
I believe the map of Africa is very beautiful and I really love this continent. It motivated me to design a mathematical figure by Africa. My first continents-inspired figure is fractal Africa:
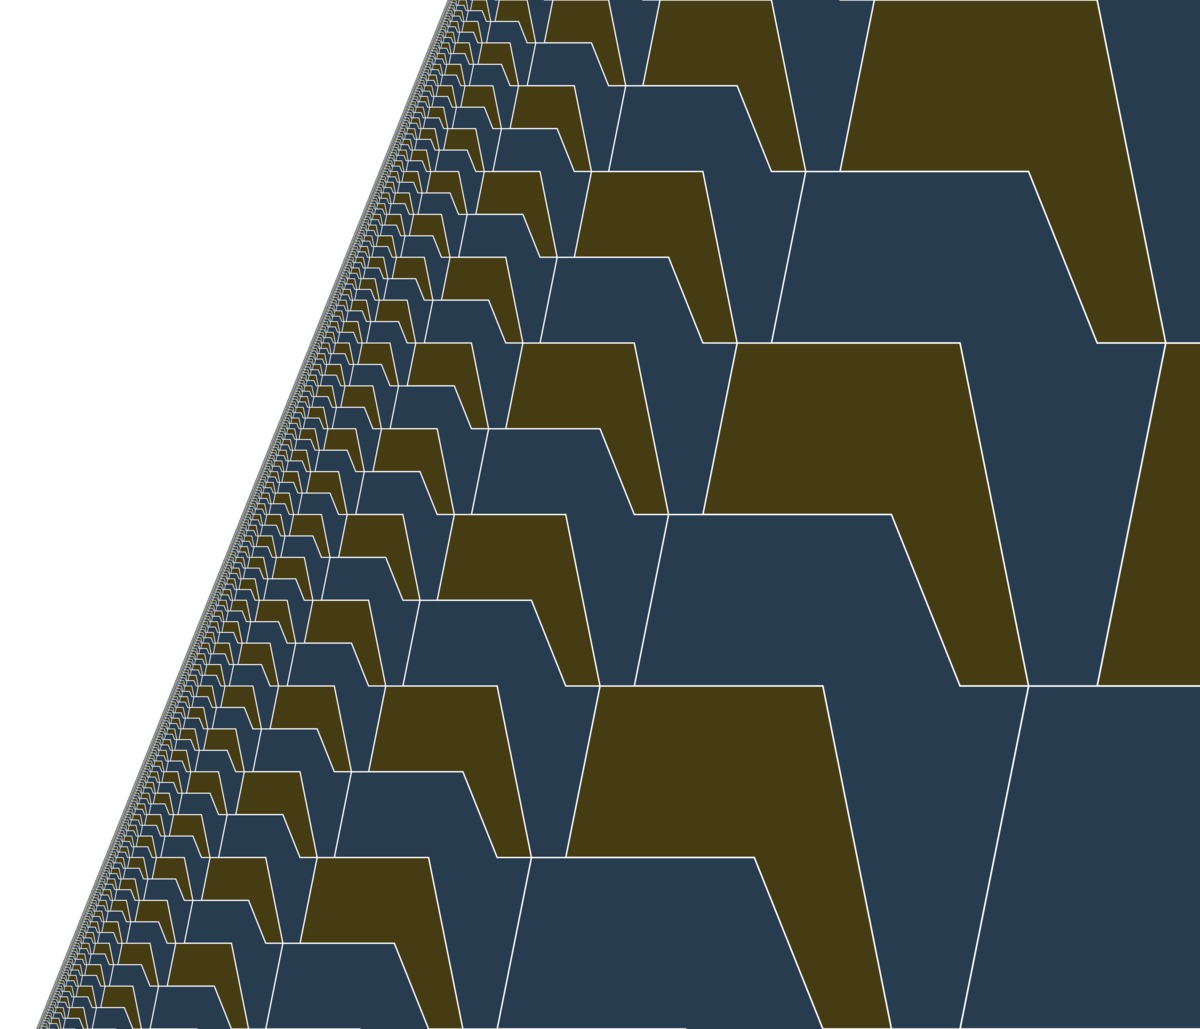
The fractal Africa is created by an Africa-like octagon and its lateral inversion. From my point of view, it is the most similar octagon to the map of Africa: 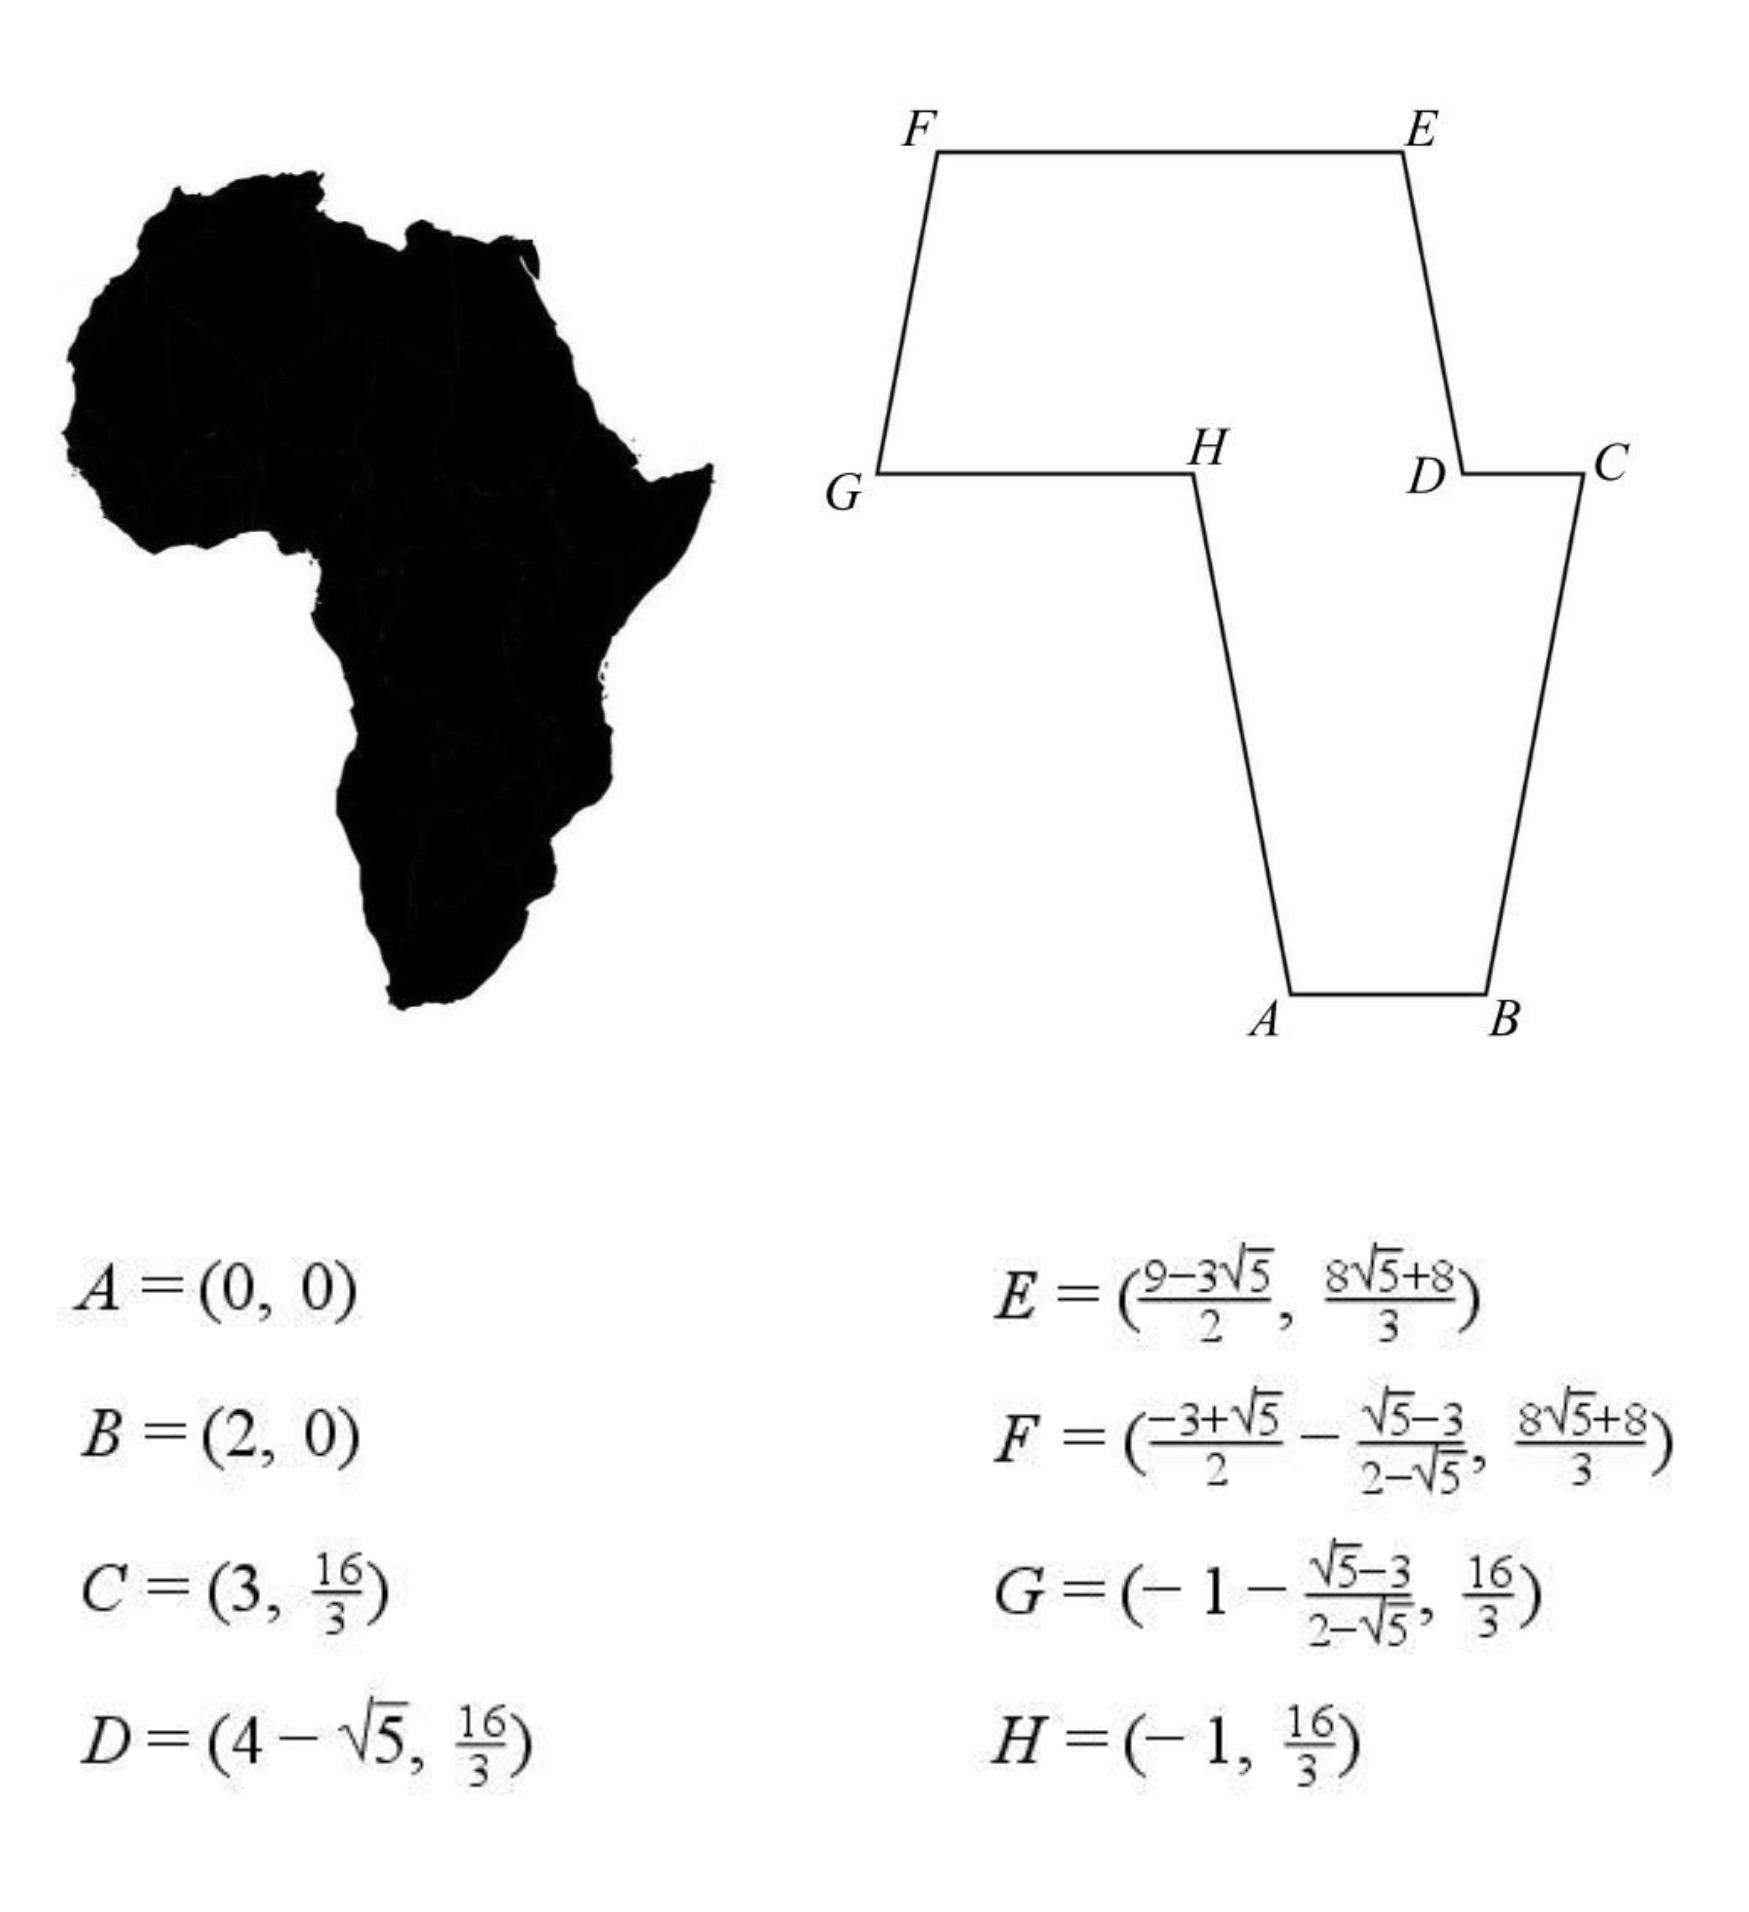
The structure of this fractal is very similar to the rabbits family tree which was introduced by the Italian mathematician Leonardo Fibonacci (1170-1250). In this fractal, the number of the octagons of each size is related to the Fibonacci numbers. The fractal determines an infinite number of isosceles triangles in the plane. The number of the isosceles triangles of each size is related to the Fibonacci numbers too. The height of the biggest octagon in this fractal is φ times longer than the height of the second (or third) octagon; where φ is the golden ratio (φ=1.618...). The fractal Africa is exactly similar to an infinite number of its parts. Therefore it is a self-similar pattern.
South America & Africa Tessellations
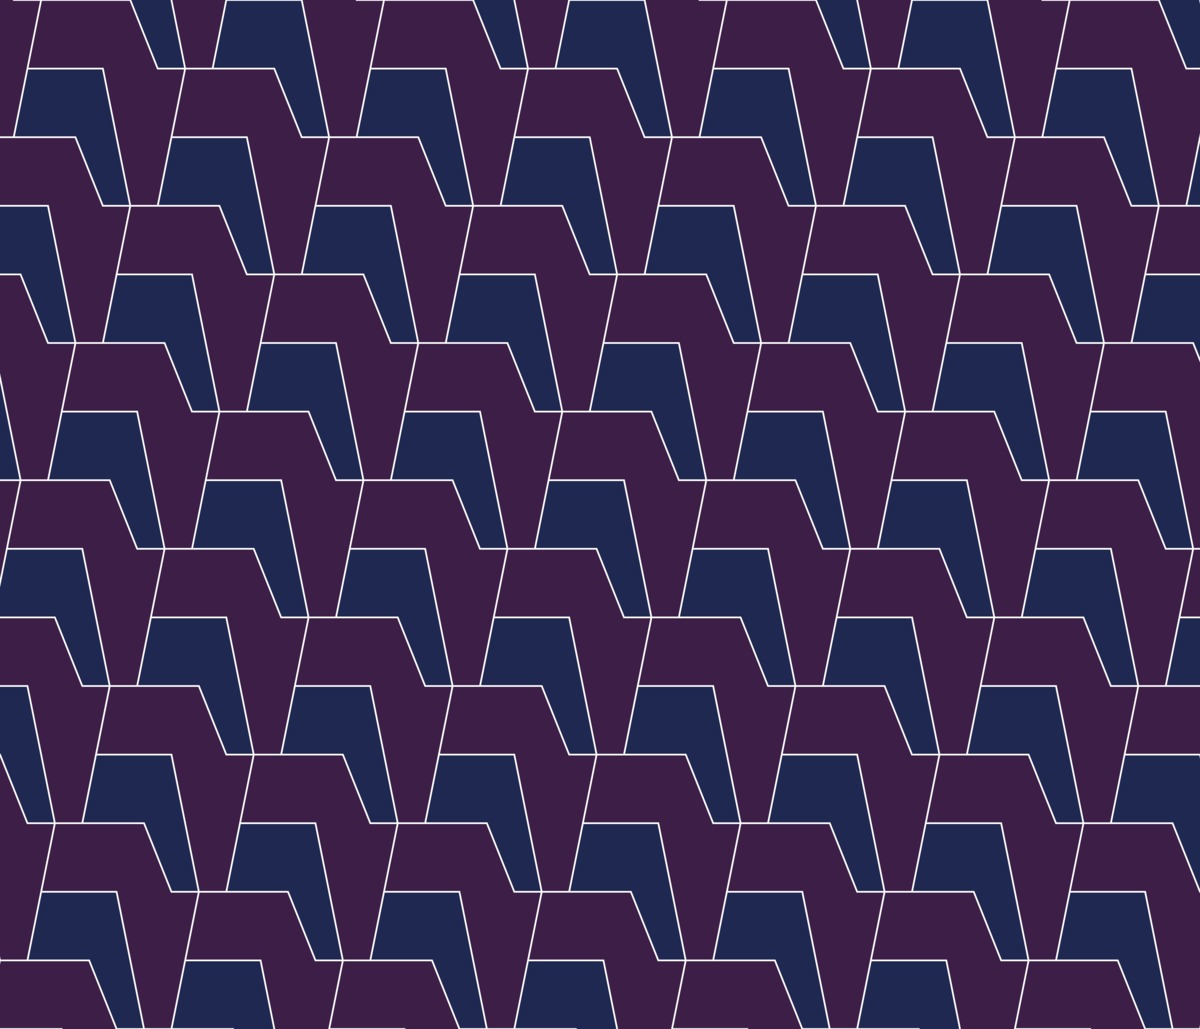
Millions of years ago, Africa and South America were joined together. They were parts of the Pangaea supercontinent. Alfred Wegener (1880-1930) was the first person who discovered this fact. The following images show two Africa and South America tessellations which are inspired by Pangaea. Each of these two tessellations is created by an Africa-like octagon and a South America-like hexagon. The octagon of the first tessellation is mathematically similar to the octagon of the second tessellation. But the hexagon of the first tessellation is not mathematically similar to the hexagon of the second tessellation.
South America & Northern America Tessellations
The following images are two tessellations inspired by Northern America and South America. Each of them is created by a Northern America-like pentadecagon (15-sided polygon) and a South America-like pentagon.
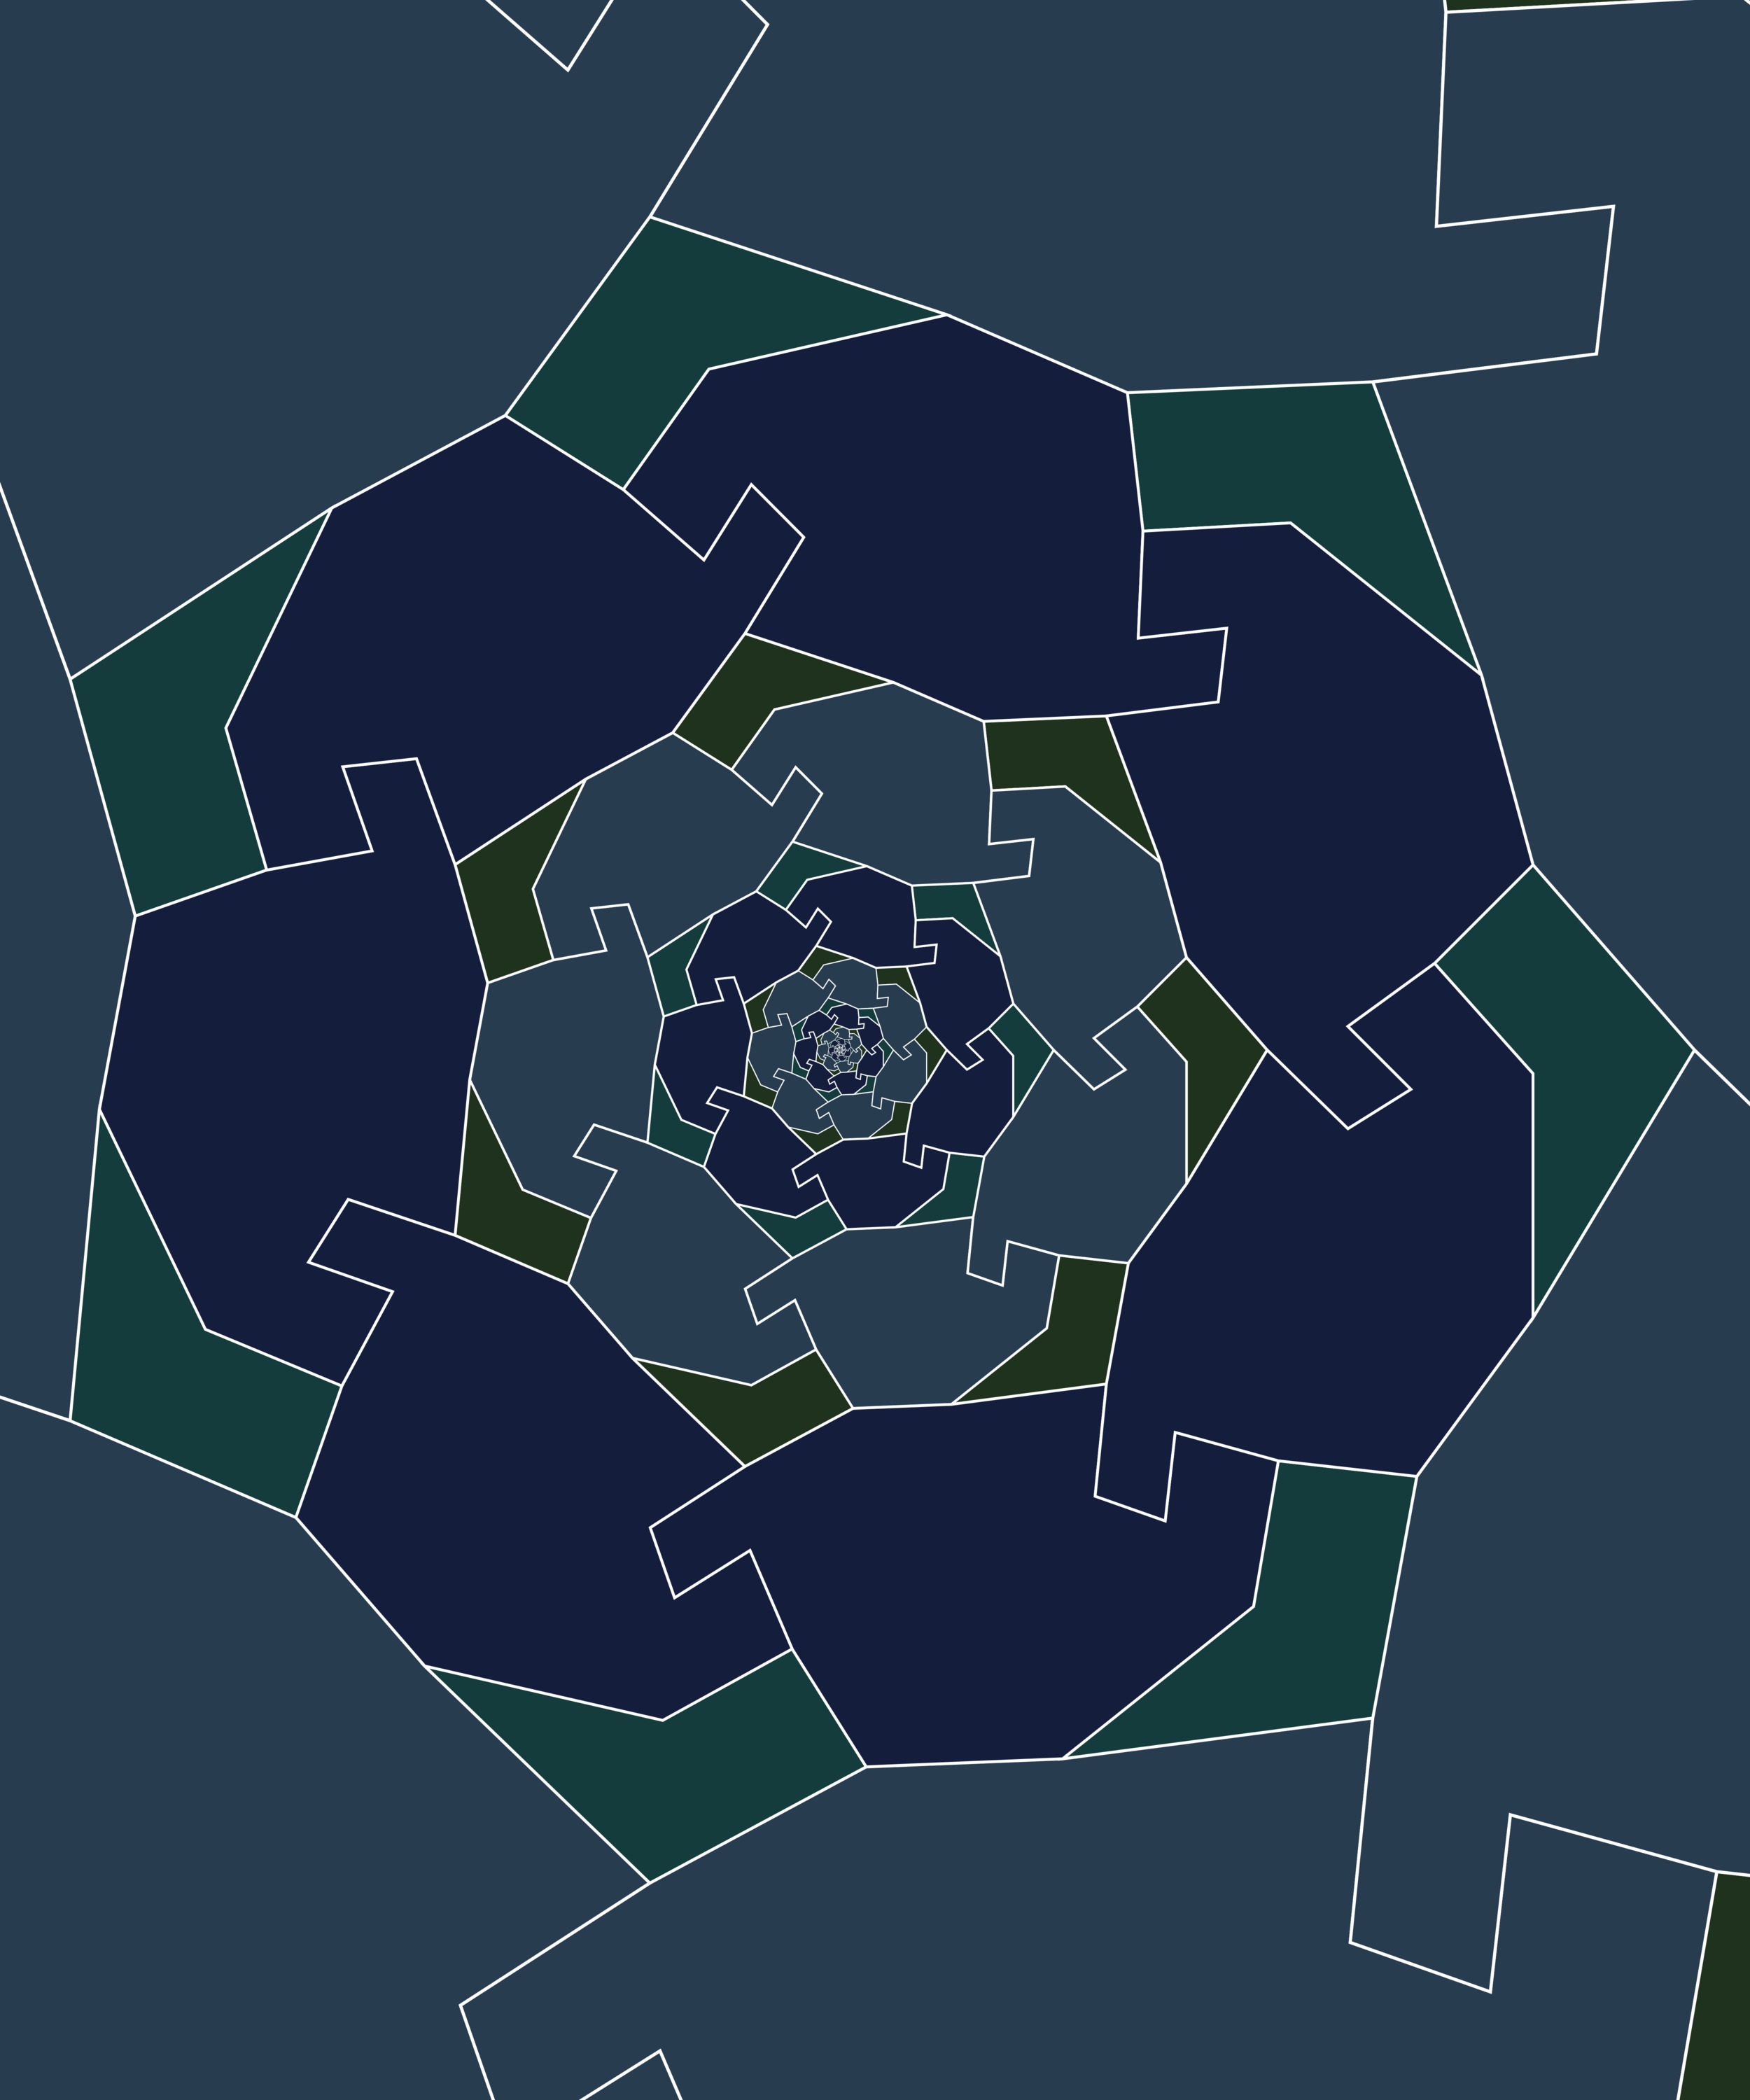
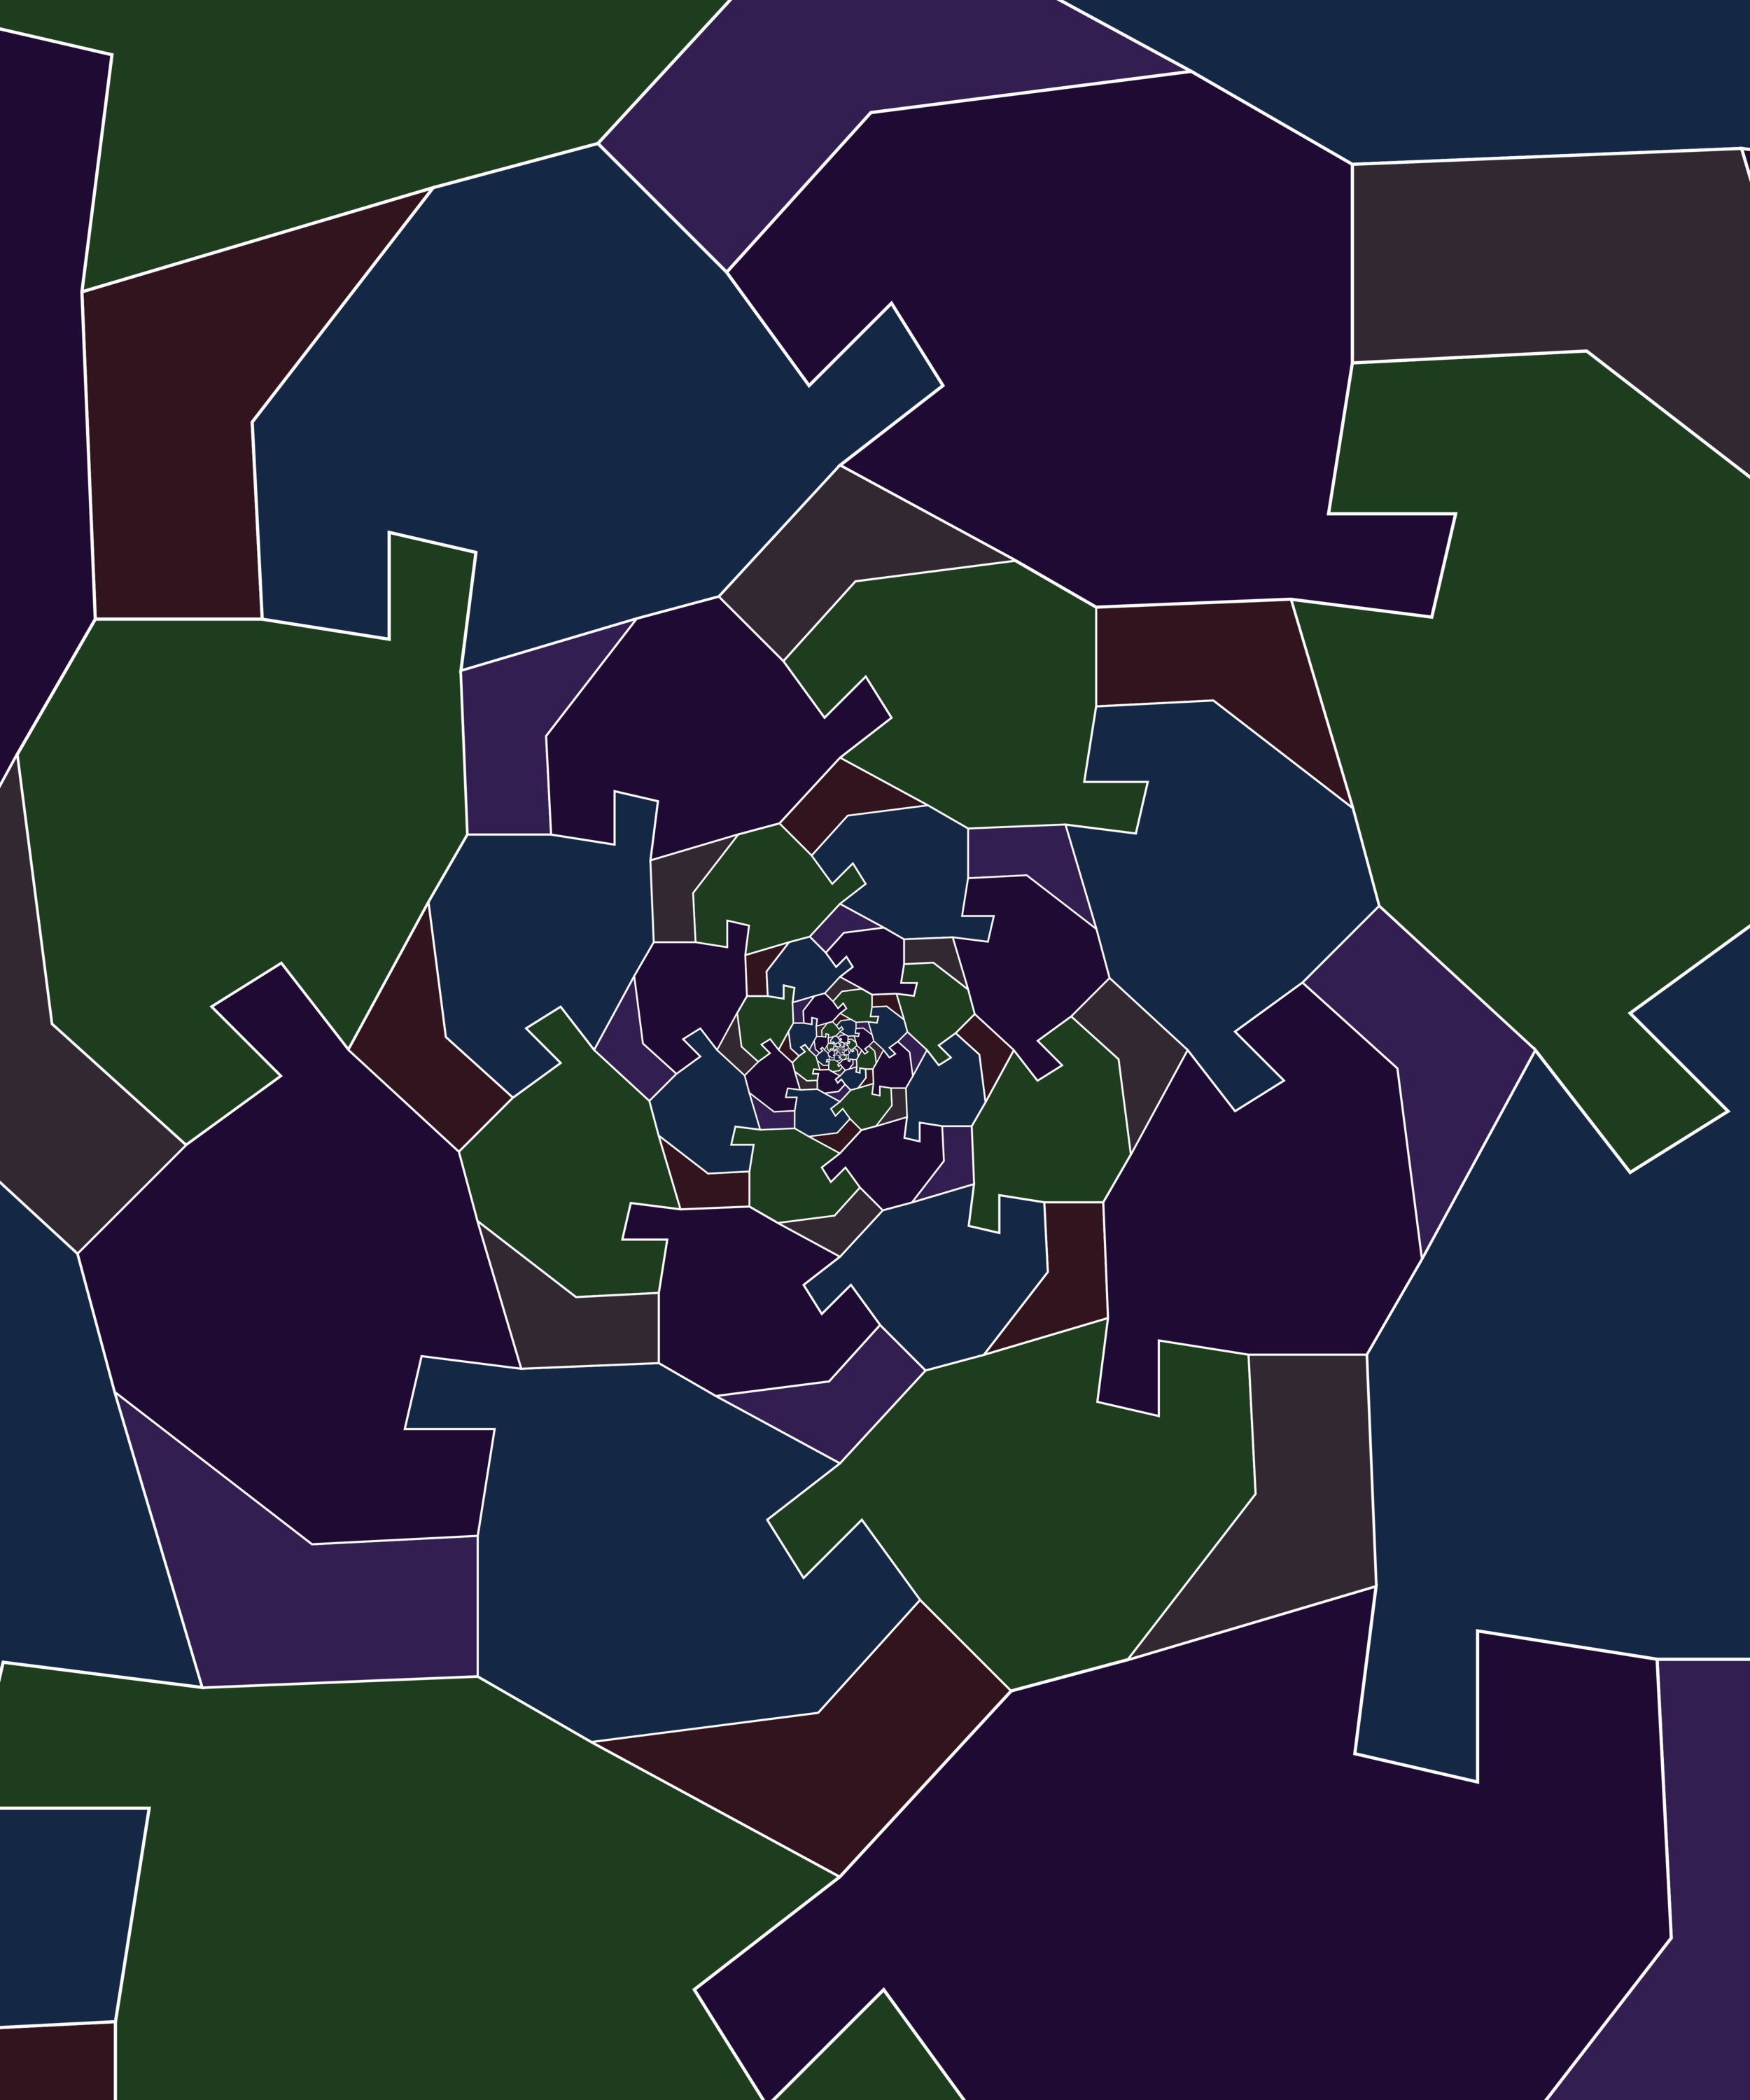
The second South America & Northern America tessellation is designed by using the logarithmic spiral. Also, the complex number (1/2)^(1/8)*e^(2πi/8) plays an important role in this tessellation:
The second approach is to find some valuable mathematical figures by searching on many figures created by computer programs. For example I have found the following two figures by viewing tens of thousands of computer-generated images. The first image shows a bird-like figure and the second image shows a boat-like figure:
A Bird in Flight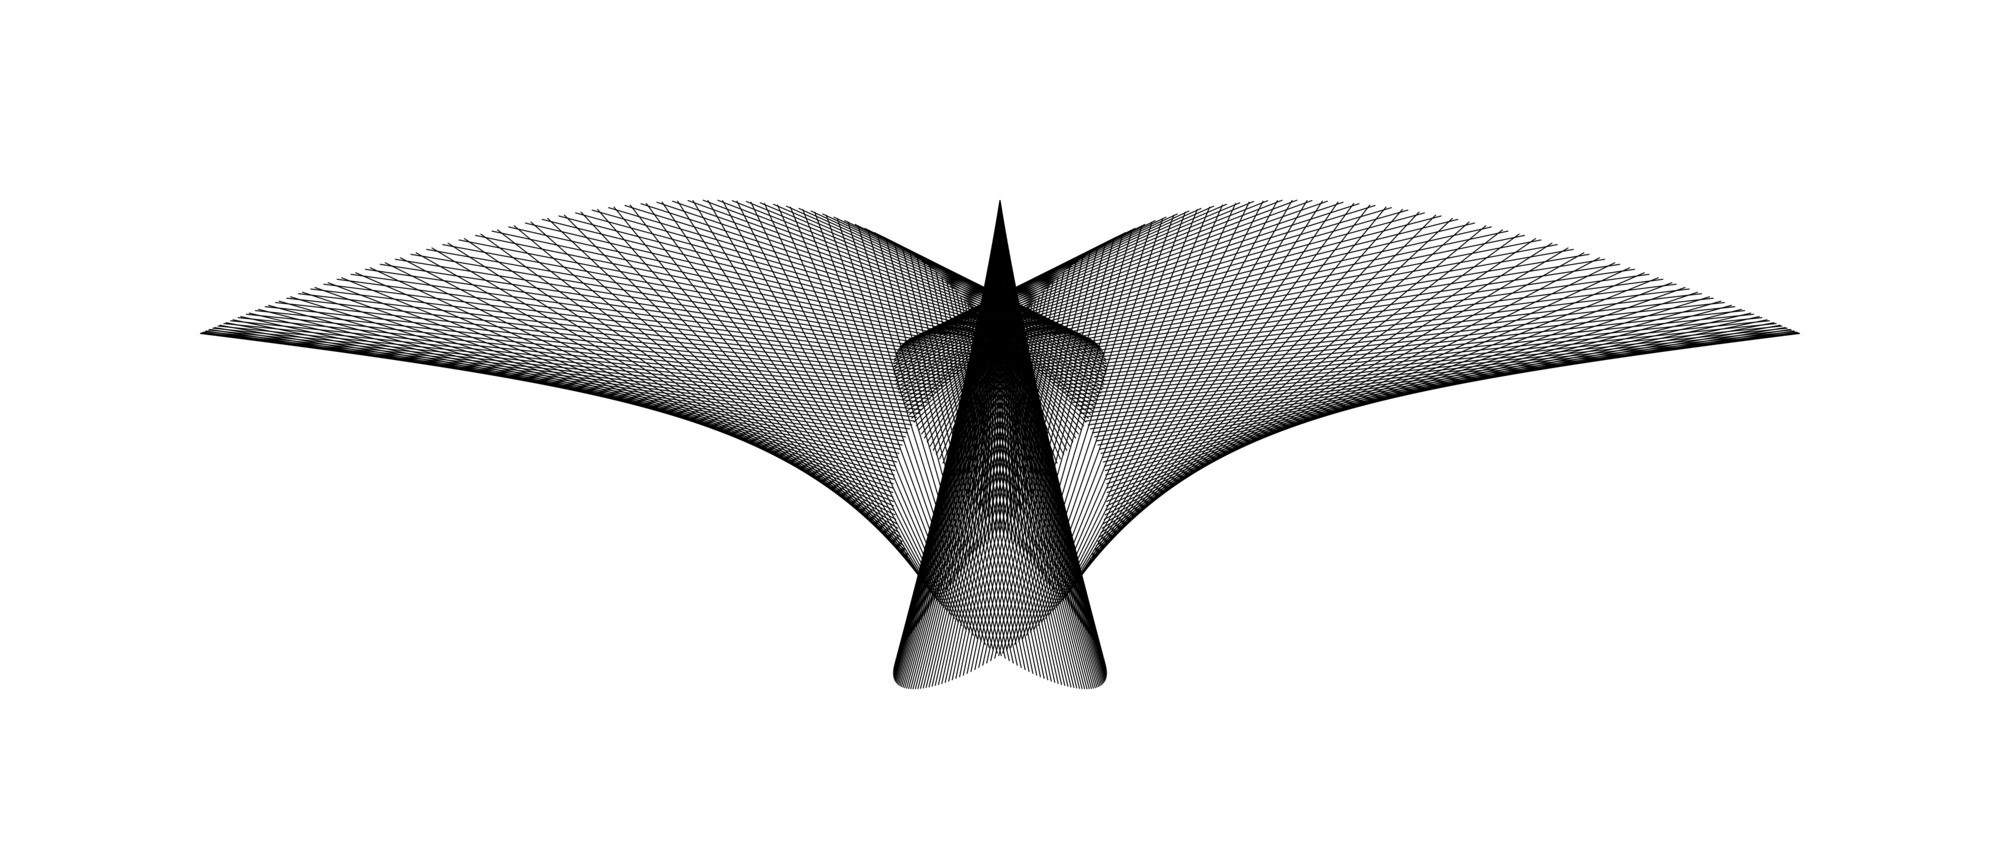
This image shows 500 line segments. For each i=1,2,3,...,500 the endpoints of the i-th line segment are:
((3/2)(sin((2πi/500)+(π/3)))^7, (1/4)(cos(6πi/500))^2)
and
((1/5)sin((6πi/500)+(π/5)), (-2/3)(sin((2πi/500)-(π/3)))^2).
Sailing Boat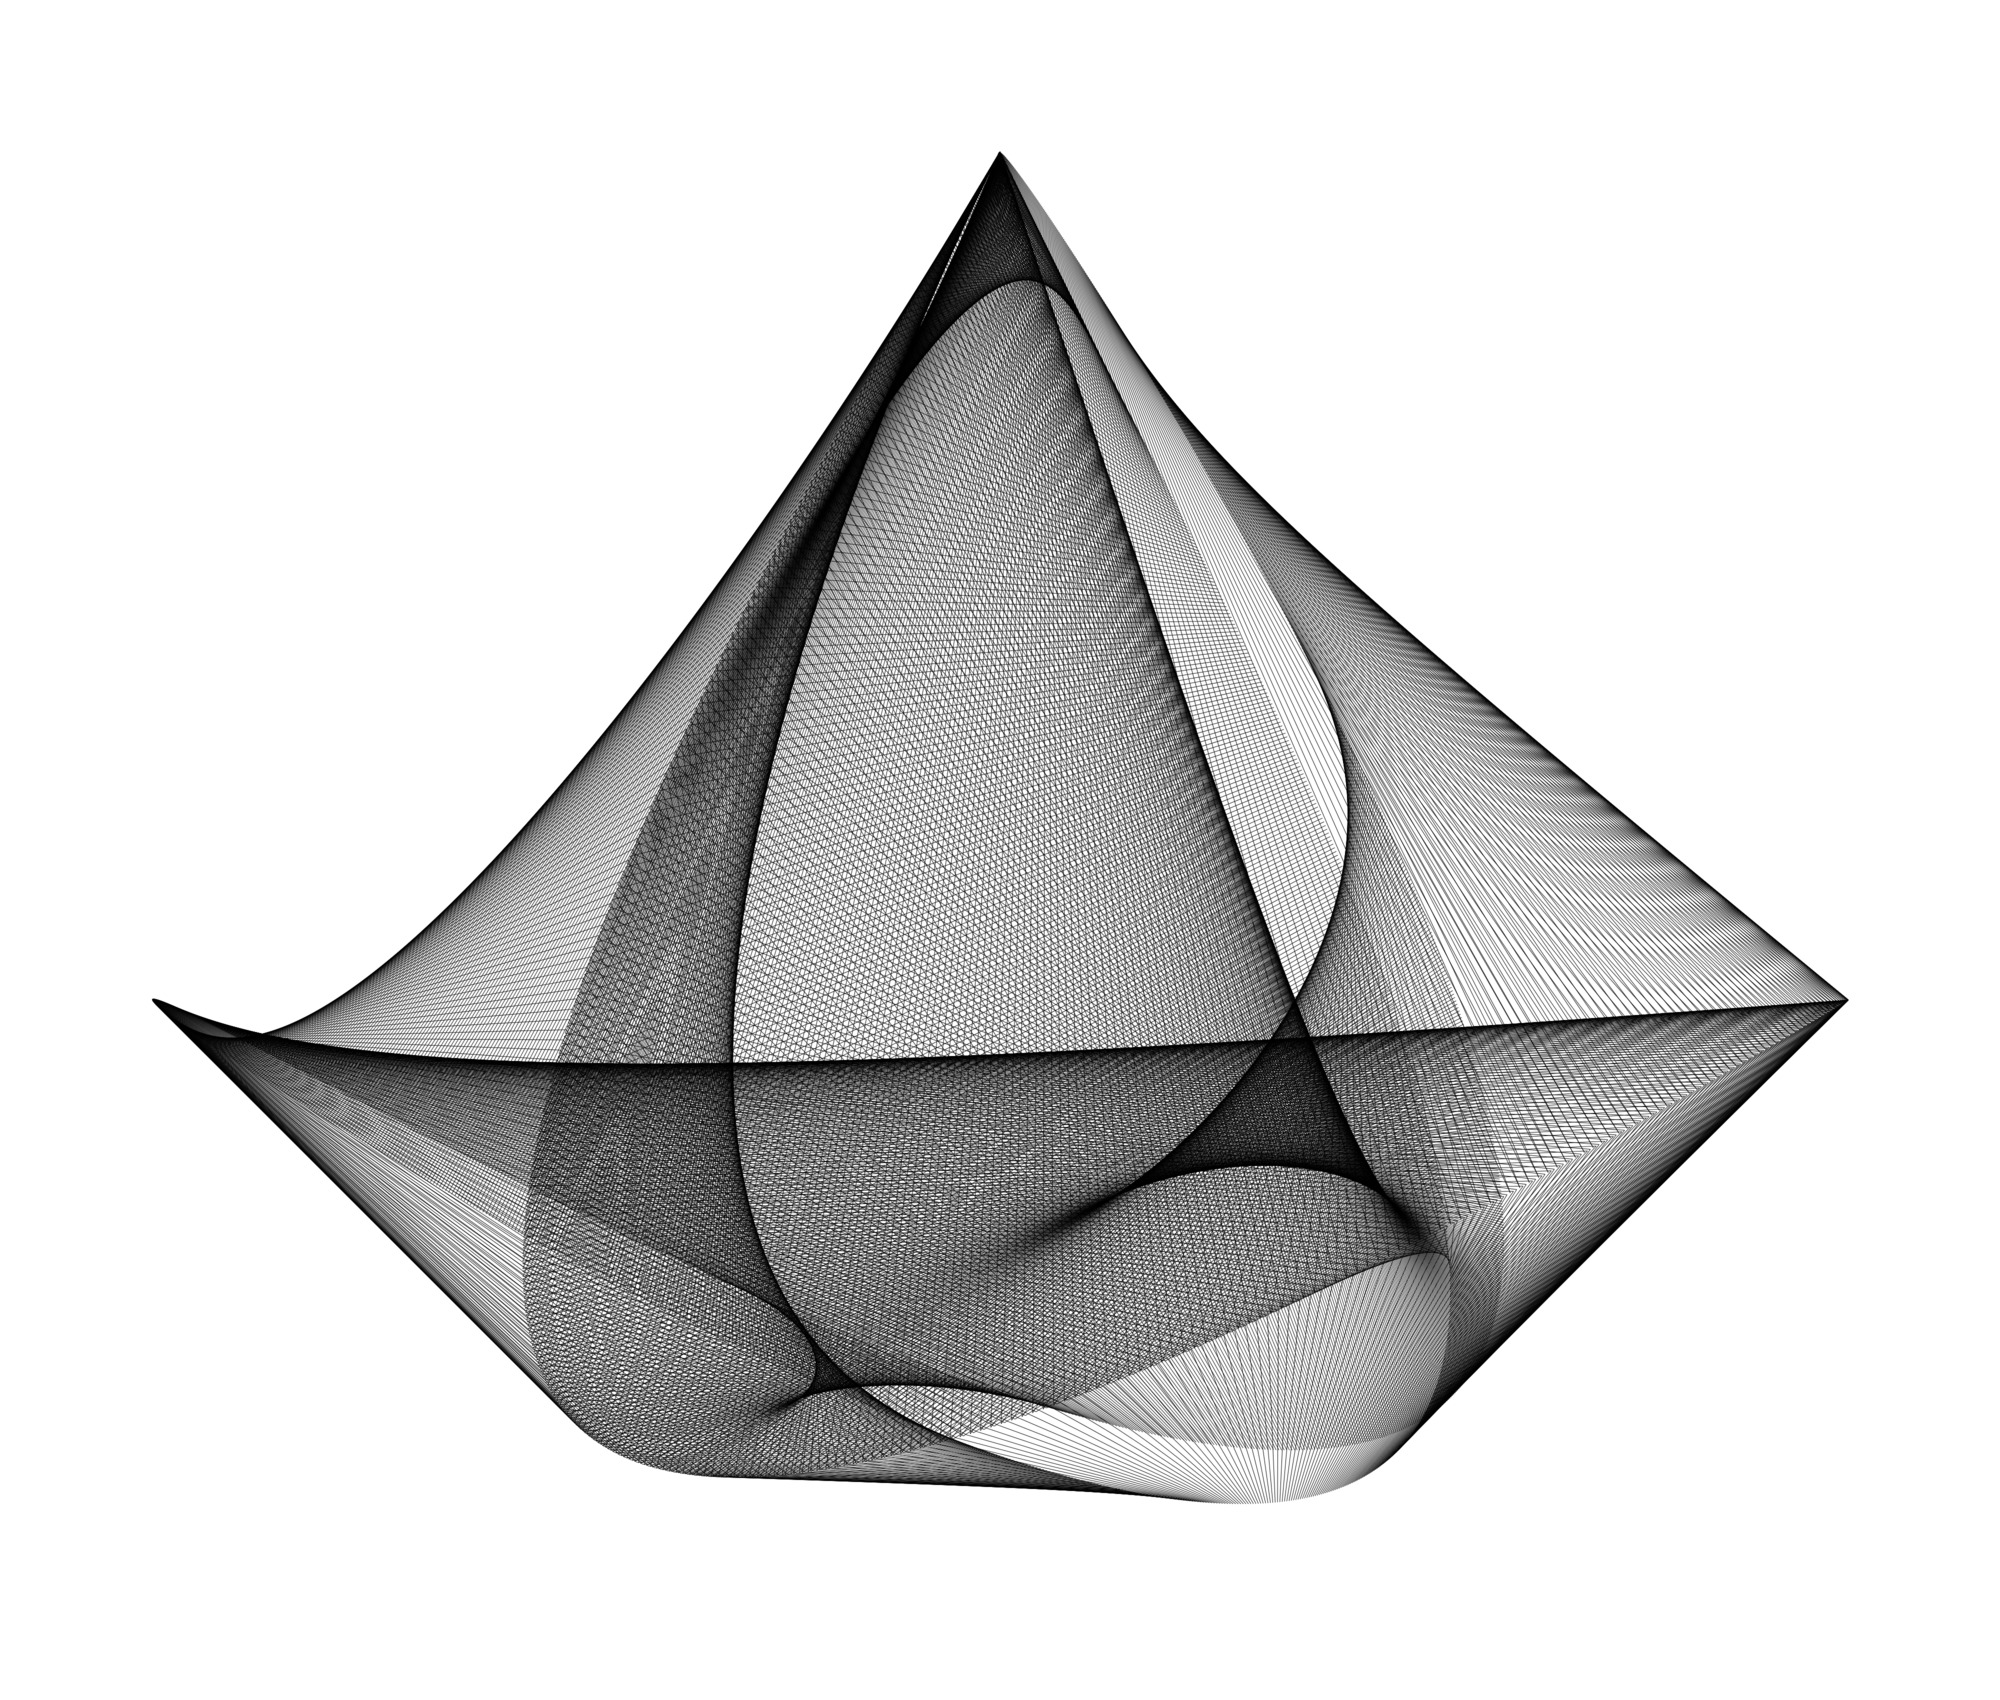
This image shows 2,000 line segments. For each k=1,2,3,...,2000 the endpoints of the k-th line segment are:
(cos(6πk/2000)-i cos(12πk/2000))e^(3πi/4)
and
(sin((4πk/2000)+(π/8))+i sin((2πk/2000)+(π/3)))e^(3πi/4).
See more images at: mathematics.culturalspot.org.