
The Washington Post reports that voter registration is down among Blacks and Hispanics, and could pose a "serious challenge" to the Obama campaign.
Unfortunately, it is the Washington Post's statistics that are seriously challenged.
The source of this information is the Census Bureau's Current Population Survey, also called the CPS. The CPS is a very reliable survey. The federal government uses the CPS to calculate the unemployment rate -- among many other important uses -- and expends considerable resources to ensure that it is accurate. The CPS has a huge sample size, an impressive response rate, and is meticulously scrutinized by the world's best survey researchers.
It would appear that I am leveling a very serious allegation that the CPS is flawed in disputing the Washington Post's reporting.
However, I do not have a problem with the CPS, I have a problem with how the Census Bureau reports voting and registration rates from the survey.
The CPS registration and voting statistics are reported from a limited number of questions asked on the CPS questionnaire in a November of an election year. These questions are very useful to those who are interested in elections because the CPS's large sample size allows fine-grained analysis of sub-populations, such as minorities or the disabled, which are simply not possible with typical smaller-sample election surveys.
To understand my contention that the Washington Post's analysis is flawed, I must explain how the voting and registration questions are asked.
The CPS asks a single person to report for all citizens age 18 and older living in a household if each person voted:
"In any election, some people are not able to vote because they are sick or busy or have some other reason, and others do not want to vote. Did (you/name) vote in the election held on ____?"
- Perhaps someone does not wish to reveal if they voted, even if they did, and simple refuses to answer the question.
- Perhaps someone reporting for another household member truly does not know if they voted.
- And finally, "no response" literally means that the voting and registration supplemental questionnaire was not administered to a household member.
It is thus more appropriate to treat the three additional response categories of don't know, refuse to answer, and no response as missing responses since we do not really know if these respondents voted.
I present three turnout rates in Table 1. The actual voting eligible turnout rate is calculated by myself from the official administrative records and is widely considered by academics, the media, and policy makers to be the most accurate turnout rate. The second turnout rate is the official CPS turnout rate, as reported by the Census Bureau, and includes the missing responses as a "No." The third turnout rate excludes the missing responses from the calculations, calculated by myself from the Census Bureau's data.
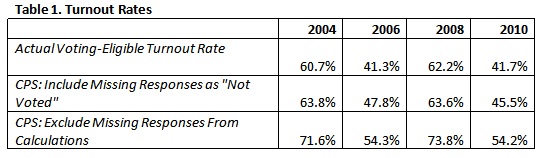
Table 1 reveals why many scholars and others have trusted the CPS as the best source for turnout rates. All surveys have what is known as "over-report bias," the difference between the turnout rate on the survey and the actual turnout. The official CPS turnout rate has an exceptionally small over-report bias when counting missing responses as "No."
However, there are troubling problems with the CPS in recent elections. Compared to 2004, the 2008 CPS turnout rate declined by 0.2 percentage points when the actual turnout rate increased -- and there is no way that it could have possibly declined since the increase in voters exceeded the increase in the voting-eligible population. Compared to 2006, the 2010 CPS turnout rate declined by 2.3 percentage points when again the actual turnout rate increased. These differences are likely not random statistical error, either, since they fall outside the margin of error of the CPS.
When the missing responses are removed from the CPS calculations in the third row, the CPS now tracks the actual turnout rate more closely, but the over-report bias is much greater. In fact, the CPS over-report bias is now comparable to the over-report bias in other election surveys, such as the venerable American National Election Study.
Given this information, it is more plausible -- and simply common sense -- that the missing responses should be treated as truly missing data rather than being categorized as a "No" response.
Correcting the CPS by excluding missing responses to the registration question, rather than treating them as a "No," reveals the flaws in the Washington Post's voter registration analysis.
In Table 2, I report the Census Bureau's official registration rates by race. In Table 3, I report the corrected rates that exclude the missing responses.
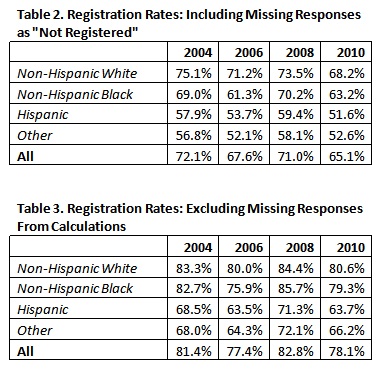
The patterns in Table 2 might indeed concern the Obama campaign. Registration rates for all groups are trending downward, particularly for Hispanics. But, what is really happening is that there are more missing responses. The corrected data show that Hispanics are registered at a statistically-indistinguishably slightly higher rate than 2006 and Blacks have experienced a significant registration increase.
The Obama campaign appears better situated in terms of registering of Blacks and Hispanics in the wake of the 2010 election than in the wake of the 2006 election. That these minority populations are also growing in size relative to the non-Hispanic White population should give more worry to the Romney campaign than to the Obama campaign.