
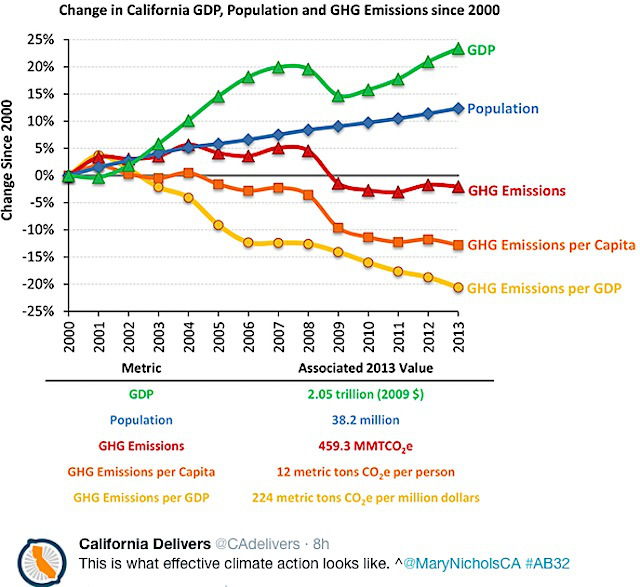
"This is what effective climate action looks like," tweeted Mary Nichols presenting this graph showing that California's drop in emissions is not due to a reduced economy.
Since 2006, the state has had a renewable energy standard requiring the addition of more clean power - now, in 2015, clean energy powers 25% of all electricity used in the 8th biggest economy in the world.
The same thing is happening worldwide. As more renewable energy is being added to the world's grids, there has been a measurable drop in carbon emissions.
There might seem to be a sort of obvious connection between these two facts, but unlike Mary Nichols, most news reports have failed to put things together, treating them as separate news stories. Or rather, not covering the worldwide increase in renewable energy.
In recent years, there has been a spate of stories about lowered carbon emissions in the US, the EU, and China. But the drop in carbon emissions is typically attributed to reduced economic activity as a result of the global financial meltdown after 2008 - not the ramp-up in renewable energy that occurred at around the same time. The general media has been slow to make the connection to the increase in renewable energy that accounts for at least some of it.
Lower "demand growth" just means more people went solar.
One of the metrics looked at as a factor is lower demand growth. The assumption was that the only cause of reduced demand growth is reduced economic activity; and so researchers were expecting to see demand reduction as a result of the economic catastrophe.
But actually, demand growth is also reduced every time anyone switches to incandescent lightbulbs, buys a more efficient fridge or computer or puts solar on their roof, or when a big box store gets its electricity from onsite solar or uses ice to freeze wind power at night to use it during the day to keep air conditioners humming.
The electric utility only sees that all of these customers now use less grid power; demand is reduced.
The clearest example is Australia, because the much touted utility death spiral is well under way there. In 2011, only 5% of Australian homes had solar, three years later, a world record 19% of Australian homes are solar powered.
Partly in response, Australian electric utilities raised prices, leading even more people to move to more efficient use of electricity to save money. With less use of grid electricity, demand growth has dropped in Australia, even as population and GDP has risen.
So there is a clear relationship between an increase in distributed generation and efficiency (which has grown in the last six years) and reduced demand growth.
As more renewables are added, emissions go down.
A similar relationship is seen at the utility-scale with renewable energy. Over the last eight years, there has been a rise in renewable energy, and it is starting to show up in a slowed growth in carbon emissions. Since 2005, US emissions dropped 10%. In just 2014, the EU registered a 4.5% drop.
A spokesman for the European Wind Energy Association pointed out the connection between carbon emissions and renewable deployment to ReCharge.
"It's telling that power-sector emissions fell substantially more than industrial emissions. The rise in renewables generation has had a significant impact. Last year the wind industry installed more new capacity than gas and coal combined."
In the EU, almost 80% of new generation coming online by 2014 was renewable.
China has increased its installed capacity of wind power almost twenty-fold from just 5.9 GW in 2007 to an "astonishing" 116 GW in 2014 according to GWEC. China is building wind farms at an amazing clip - nearly 2 GW a month. That is like building two nuclear power-stations-worth of power every month.
And in 2014, for the first time, China's Carbon emissions dropped 2% as it cut coal use by nearly 8%, while ramping up its investment to $89 billion in clean energy, efficiency and energy storage.
Not only wind power has increased dramatically in China. In 2013, China had already begun to absorb some of its own overproduction that have caused solar panel prices to drop globally, adding 13 GW of solar.
"The IEA has identified shifting energy consumption in China, the most populous nation with 1.4 billion people, as among the reasons global carbon dioxide emissions was flat last year," said BNEF.

In the US, nearly all renewable energy has been added to the grid since 2008. (In fact, one connection to the global financial crisis was the stimulus which funded a lot of the huge renewable growth since 2008.)
US wind grew from 2.5 GW in 2000 to 67 GW as of the end of 2014.
Little weight has been given to the effect on GHGs of the Cap and Trade plan being implemented by the Regional Greenhouse Gas Initiative (RGGI) in 8 northeastern US states, which capped emissions from coal power plants, and ratcheted them down each year. Their cap and trade plan funneled what amounts to pollution fees to support and fund incentives and subsidies and grants for clean energy and efficiency.
It's not the financial crisis.
The first stories to cover this - now 45% - drop attributed it to the 2008 economic meltdown.
Only very recently have the - normally very fossil-friendly - EIA in the US, and the IEA internationally begun put the two trends together; that emissions are dropping in many regions around the world - precisely because of the rise in renewable generation.
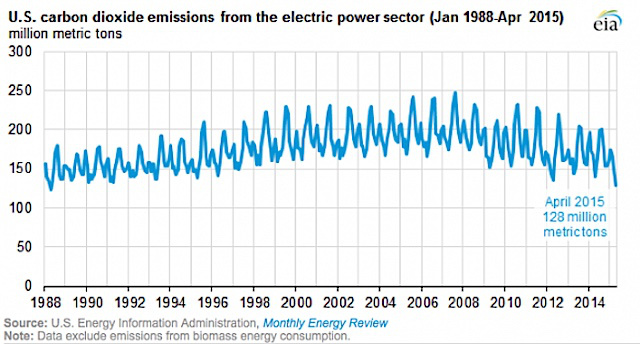
At the end of 2014, EIA finally admitted that US carbon dioxide emissions (CO2) have declined in five of the past eight years, and actually linked it to the increase in clean energy.
"The overall decline in carbon intensity of electricity generation, through both reduced fossil fuel carbon intensity and increased noncarbon generation, has reduced cumulative CO2 emissions from power generation by about 1.6 billion metric tons since 2005."
Finally! So why has it taken so long for this connection to be made?
People don't know, because renewable energy is not "news".
Even back in 2008, you could read news about 'clean tech' as they called it then, in regular sections in the New York Times, and other major news sites. No more.
Now, the only 'tech' covered on major news sites is electronic news about smart phone apps and various electronic gizmos. To find news about the rapid growth in renewable energy, you need to search out the few sites like Earthtechling that cover it, or just trade magazine sites like Renewable Energy World.
It's as if the topic of clean energy has as much general interest as some sort of dull subject of no great importance to the general public; as if it is about as relevant to the average person as tractor parts news.
Yet this change in news coverage happened, ironically enough, just as renewable news has become more newsworthy. Assuming that climate change and the deployment of clean energy - the key to our potential for maintaining any long-term future civilization - is newsworthy.
But as a result of the ghetto-ization of renewable news, hurried general news reporters have been slow to connect the dots - that ramping up the amount of renewable energy on the grid is cutting carbon emissions.
But the evidence is there.
Image credits:
CARB
AWEA
EIA
Read more on UnderstandSolar.com, where this post originally appeared. You can also follow us on Facebook.