
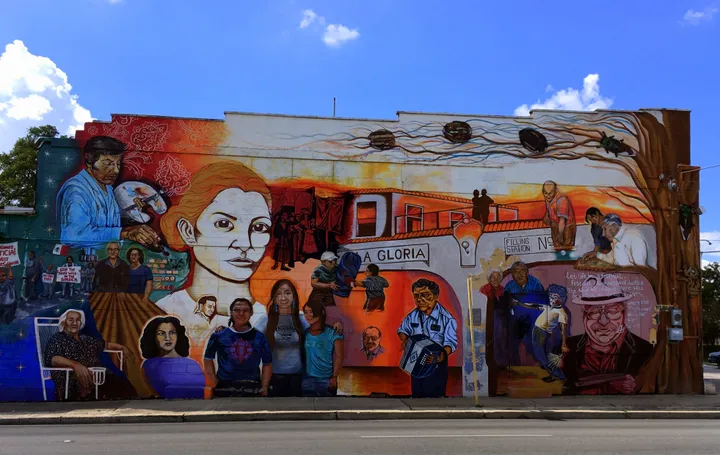
San Antonio’s impoverished West side has a vibrant mural scene, as depicted on the side of this building and many others.
As San Antonio, the seventh largest city in America, claims its place on the national stage, it will need to address one of its most chronic and persistent issues, the exceptionally low graduation rates of some of its hardest-hit ZIP Codes. Almost 300,000 people — or roughly 20 percent of the population — have not graduated from high school, split almost equally between those who have not passed ninth grade, and those who have spent some time between ninth and twelfth grade, but left before receiving a high school diploma or a GED.
Using a “Hardship Index" on recent U.S. Census Bureau data, according to a formula established by Brookings Institution researchers in the 1970s as a way to compare U.S. cities, four ZIP Codes — two to the east and two to the west of downtown San Antonio emerge as the highest-hardship areas of the city. Of the almost 110,000 people who live in those four ZIP Codes — 78202, 78203, 78207 and 78237 — more than half have not completed ninth grade. In 78207, a ZIP Code historically associated with high hardship, that figure rises to more than one in four residents. (See graph below.)
Can we pause a moment to talk about the implications?
To see figures that high, in 21st century America, is to be profoundly shocked, at almost a cellular level. A modern American city — one of the top 10 in the country — where almost ten percent of the population hasn’t graduated from ninth grade?! It’s pretty much unthinkable.
“There’s a moral imperative to address this,” says Matthew Martinez, Ph.D., a Rice University demographer who grew up in San Antonio’s urban core. Martinez has studied how San Antonio’s areas of chronic hardship have persisted over time, and how their historical “dropout legacy,” attached to place, influences dropout rates of students who live in those same neighborhoods today. (Martinez wrote his doctoral thesis in applied demography at the University of Texas at San Antonio (UTSA) on this topic, and worked closely with associate professor and department chair Johnelle Sparks, Ph.D., in developing the theory.)
Education researcher and policy advocate Camille Farrington notes that dropout rates are historically higher in Black and Hispanic neighborhoods, and that “urban high schools typically lose about half their minority students prior to graduation.” In her book Failing at School: Lessons for Redesigning Urban High Schools, she compared the 68.8 percent national norm for high school graduation in 2007 with the rates for:
- Native Americans (51 percent),;
- Blacks (54 percent);
- Latinos (56 percent);
- Whites (77 percent); and
- Asians (81 percent).
In predominantly Hispanic San Antonio, across all ZIP Codes, the overall high school graduation rate obscures the dangerously low figures from the highest-hardship areas. (There’s also the factor of San Antonio’s high concentration of active-duty and veteran-intensive ZIP Codes, which tends to skew those figures higher, since more within have high school diplomas — and in other metrics, stable incomes. Shall we call this “the ‘Military City’ Effect”?!)

The façade of the Guadalupe Cultural Arts Center, in ZIP Code 78207, on San Antonio’s predominantly Hispanic and historically economically depressed Westside.
These low graduation rates harm earning powers. As discussed in a previous article, when compared to the U.S., San Antonio has lower educational attainment at every level; and with that, lower income at every educational level. Over the course of a lifetime, that translates to high school dropouts earning at least a quarter of a million dollars less, on average, than their peers with high school diplomas or, according to Farrington. (Of course, those with less than a ninth grade education are consigned to earn that much less.) Societally, these costs add up to “approximately $192 billion in lost income for every new cohort of 18-year-olds that doesn’t complete high school,” says Farrington, whose figures are from 2005 and are likely higher today, as a result of inflation.
Add that to the other economic costs of under-education. Limited education has been linked to a broad spectrum of negative outcomes, from difficulty finding employment to poor health, even involvement with the judicial system. An in-depth look at any of these factors, evident from the series of maps of population characteristics about San Antonio, proves this point. In addition, many of the “costs” from low educational attainment are societal as well as individual. Martinez sees this as baked-in residential segregation and income inequality, visible over multiple decades in a geography of poverty attached to place.
How this fits together
We began this series by talking about the need to broaden the so-called “equity lens” that San Antonio has committed to using with its $2.7 billion budget for 2018. Located far away in the Pacific Northwest, with a very different population and based on very different economic realities, Seattle, Washington (population 704,358) went first with the idea of using an equity lens, and San Antonio to a certain degree is following in its steps. But San Antonio is a very different city, and any comparison starts to fall apart immediately. (For example, on ninth grade completion rates, or ninth to twelfth without achieving a diploma, you’d need to scroll all the way down on either graph to get to Seattle’s comparatively very healthy rates of 3.2 and 3.4 percent respectively.) The next article in the series, “The Geography of Poverty,” introduced the “Hardship Index” as a way to quantify highest-need areas in a city known for having some of the highest income inequality and residential segregation in America — and as a way to anticipate being able to triage limited resource more effectively to areas of need.
But after what amounts to about 800 hours of looking at data and creating hundreds of maps and bar charts comparing populations characteristics by ZIP Code, it’s the distressingly low educational attainment rates in the city’s highest-hardship areas that concerns me the most.
To get a sense of just how bad those numbers really are — and to see whether anything else might explain them — I took a look at some initially obvious items, like percentage of immigrants and level of language proficiency in the affected areas. Residential mobility, especially past year mobility, is another indicator of problems. But while the results were always “interesting,” nothing was as illuminating as simply comparing those rates against the benchmarks of other cities, resulting in the two graphics above, about less than ninth grade, and less than ninth through twelfth grade, completion rates.
The cities included as comparables fell into the three categories:
- The rest of the “Top 10 Cities” by population, according to recent Census information;
- Other Texas cities, such as El Paso and Corpus Christi, which have also have significant Hispanic populations; and
- Just for fun, the list of cities where Southwest Airlines flies, because it’s a large and diverse list of cities.
You can see the results above, in the paired graphs about education levels. You can also view a data visualization here on the Southwest cities only, across every level of educational attainment. It’s instructive as well, but the other graphics are more powerful regarding the four ZIP Codes’ particularly distressed numbers. And the maps regarding citizenship, naturalization, and levels of English language proficiency are here. They weren’t as conclusive as they might have been, even though structural poverty and institutional racism are a thing.
Educators talk about a “ninth grade bubble,” which is outside the scope of this article to communicate fully, but it has to do with how ninth grade ranks swell with attendees, far more percentage-wise than grades on either side of them, and for a reason. Ninth grade is a pivotal time for students, a “make it or break it” year where class credits needed to graduate start accumulating for the first time, and even good students can find it hard to make the transition to what is being expected. (Not to mention, overlap with puberty, peer pressure, school changing, and many other significant factors.)
Ironically, says Farrington, “the ‘9th grade bubble’ phenomenon is seen across all races but appears particularly pronounced for African Americans and Latinos,” coinciding with racial and ethnic populations present in San Antonio’s four most distressed ZIP Codes. “Minority students were significantly more likely than White students to be retained in 9th grade and/or to be stuck there for multiple years,” she says. (The goal isn’t simply keeping ninth graders in school, but setting them up for success earlier on — and during. But again, that’s outside the scope of this article.)
But back to our story
Farrington talks directly about disadvantaged neighborhoods as indicators of poor educational success when she writes:
“The U.S. Department of Education (DoE) estimates that students in the lowest-income families (of six income brackets) drop out of high school at six times the rate of students in the highest-income families,” according to DoE’s own figures. “Students from low-income families also tend to be concentrated in high-poverty districts,” she adds.
And Martinez, who worked with UTSA’s Sparks to develop the concept of “dropout legacy,” sees something similar:
“Neighborhoods initially lacking adequate resources to educate their residents then become self-(re)producing systems of disadvantage,” he warns. (I learned about Martinez’s work from University of Texas at San Antonio (UTSA)’s Richard Harris, Ph.D., a sociologist and professor of social work, who provided statistical support for the landmark court case, Edgewood ISD v. Kirby, which challenged unequal school funding.)
When it comes to just San Antonio, Martinez has studied how persistently high dropout rates serve as “the strongest indicator of poverty across time,” all else being equal, in models using decennial Census data from 1980 to 2010. He further sees approximately the same neighborhoods by the Hardship Index — the immediate Westside and Eastside areas — as being more strongly correlated to poverty on a census tract-basis than all other census tracts in Bexar County, where San Antonio is located — areas which historically have also had the highest poverty rates in the city. In addition, his research has shown that poverty increases over time in Bexar County neighborhoods.
Martinez sees the connection to residential segregation and the lack of a unified school district, which further fragments attempts to address dropout rates in a holistic, integrated way. While the idea of a unified school district for San Antonio — most of its counterpart big cities function on this model — has been floated in the past and shot down for short-term economic reasons, Martinez expands the lens to include future social costs for not addressing the issue. But we’re getting pretty far afield. . . The most important finding of his work to date is that neighborhoods carry a legacy of place, for our purposes a dropout legacy, that independently reaches back from the past and affects current educational outcomes of students who live in those neighborhoods today, even when controlling for other variables.

Another vibrant and beautiful Westside mural.
In Houston, Martinez is part of an independent educational research consortium, planning for that city’s growing future. It’s likely that San Antonio needs to establish one as well, on a par with the new housing commission that began meeting October 4th. As San Antonio strives to cope with anticipated surge in need for housing as the population dramatically increases over the next few decades, it seems appropriate to make an equal effort addressing low educational attainment in the city’s most depressed areas as well.
Additionally, from a humanitarian perspective, it seems important to learn who the almost 150,000 people are in San Antonio who lack a ninth grade education(!) — or the more than 27,000 in just the four highest-hardship ZIP Codes alone. Who are they, how are they getting by (if in fact they are), what sort of low-wage service industry jobs have they been absorbed into, if they’re able to find work at all. What sort of challenges do they experience, and how are they able to overcome given how few resources are available? These are perfect questions for social workers to ask, or anyone else trained in culturally competent interviewing.

A warning, or an encouragement, to appreciate Westside murals, painted by residents for residents.
Concentrated disadvantage, such as we talked about in the first article, has repercussions in people’s lives, creating barriers to success across multiple domains. Farrington describes it this way:
Dropouts earn less money both because they earn lower wages and because they are more likely to be unemployed. Consequently, dropouts are much more likely than high school graduates to depend on public assistance to survive. . . . Perhaps because they have a harder time earning a living in the legitimate economy, dropouts are also much more likely to commit crimes and be incarcerated than their peers who complete high school. . . . These outcomes hold true even when researchers control for factors such as race, prior academic achievement, and family socio-economic status.
They’re also less likely to vote, their life expectancies are shorter, and of course there’s a good chance that negative consequences are passed on to their children, who also grow up suffering from generationally entrenched disadvantage, according to Farrington and others.
The Adverse Childhood Experiences study (ACEs), often described as “the largest public health study you’ve never heard of,” with a measurement instrument available in English and translated into Spanish, reinforces this concept by quantifying the impact that abuse, neglect and household dysfunction in childhood have over the course of the lifespan, including long-term effects on physical and mental health. In areas of the city characterized by chronic and persistent poverty and hardship, ACE scores are having an impact on residents, whether we recognize it or not.
And what about literacy? How is the illiteracy rate connected to low educational attainment, since reading is so crucial to educational performance? San Antonio’s illiteracy rate is second highest in the state at 25 percent, according to the San Antonio Public Library, and 71st on a list of 77 major U.S. cities, according to one national study conducted in 2014. (An earlier article in the series showed how the distribution in San Antonio of those who graduate from high school and those who achieve bachelor’s and graduate degrees mirrors the distribution of third graders who are able to read at or above their grade level. See below.)

Third grade reading levels vs. educational levels high (green) and low (red) in San Antonio, via P16+ Council of Greater Bexar County (3rd grade) and U.S. Census 2010/American Community Survey 2015 data (educational levels).
It feels like there is so much more to explore about who San Antonio’s least educated citizens are, how they got that way, and why there are several hundred thousand of them in a city of 1.4 million. Doubtless no glib or easy answers will emerge, like the prejudicial, pejorative narratives that would seek to assume that “they’re all immigrants” (they’re not) or that “they don’t speak English” (many do).
But number one, let’s stop ignoring that this problem exists. Let’s start talking about it and what we can do to improve it. And number two, let’s make sure we enlarge the scope of the equity lens to include education, not just housing and infrastructure — because all residents deserve to be part of San Antonio’s brighter future.