In his State of the Union address Tuesday night, President Barack Obama is expected to propose throwing a lifeline to America's middle class. It could really use one.
His ideas -- including tax increases for the wealthy and tax cuts for the middle class -- might or might not be the right ones. The Republicans that run Congress likely won't be amenable to many of them. But there should be little doubt that the middle class is in serious trouble. Here are six charts that prove it.
1. and 2. Middle-Class Wages Are Stagnant
A lot has been written about how wage growth has been in a funk since the Great Recession. But this is mainly a problem for the non-affluent classes, and it's been going on for a lot longer than just the past six years. Here's a chart from a recent study by the Economic Policy Institute (EPI), a think tank focused on labor issues:
The only boost middle- and low-income families have gotten since 1979 came during the tech boom of the 1990s. It's been a Sea of Suck otherwise. For the richest Americans, wages have done nothing but climb.
Here's another EPI chart that slices income growth even thinner and adjusts it for inflation:
See that sad light blue line at the bottom of the stack? That is middle-class wage growth, lagging every other class.
3. Inequality Is Basically Robbing The Middle Class
More income going to the wealthy could mean less going to the not-wealthy, along the lines of what French economist Thomas Piketty has warned -- in his view, wealth tends to grow more quickly than wages, vacuuming up an ever-greater share of the world's total income. The EPI recently estimated that inequality is robbing the middle class of roughly $18,000 in annual income:
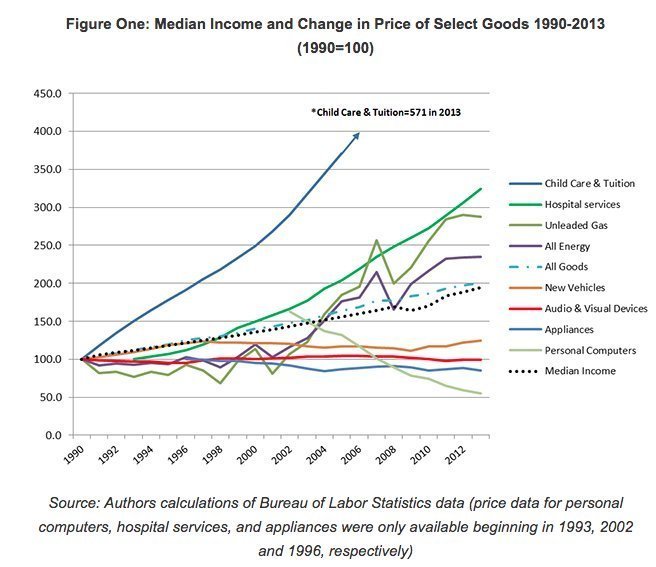
4. Middle-Class Costs Are Soaring
Meanwhile, costs that affect the middle class the most are outpacing paltry wage gains -- particularly child care and education, two things the middle class really needs to help it avoid slipping further behind. Here's a chart from a recent Brookings Institution study:
5. and 6. Middle-Class Wealth Has Disappeared
The middle-class share of the U.S. wealth pie roughly doubled between the Great Depression and the early 1980s. But since then, the middle-class share has shrunk back to its lowest level since 1947, according to a study last October by Emmanuel Saez of the University of California, Berkeley, and Gabriel Zucman of the London School of Economics. Here's a chart from a blog post they wrote about the study:
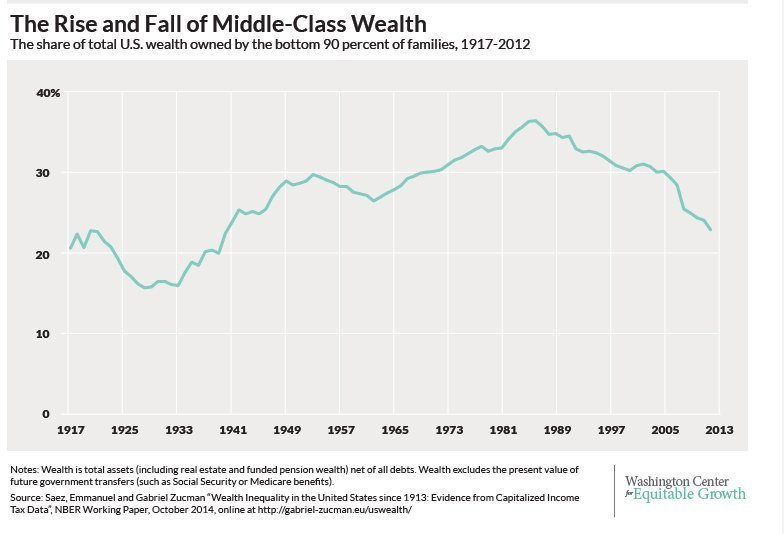
You might quibble with this chart, pointing out that the "bottom 90 percent" is not quite the same as the "middle class." One response is that most of the wealth held by the bottom 90 percent has typically been held by the middle class.
But to help bolster the case, here's a shorter-term chart, from a June 2014 study by Fabian Pfeffer, Sheldon Danziger and Robert Schoeni of the Russell Sage Foundation, with income groups sliced more narrowly, to help make the case:
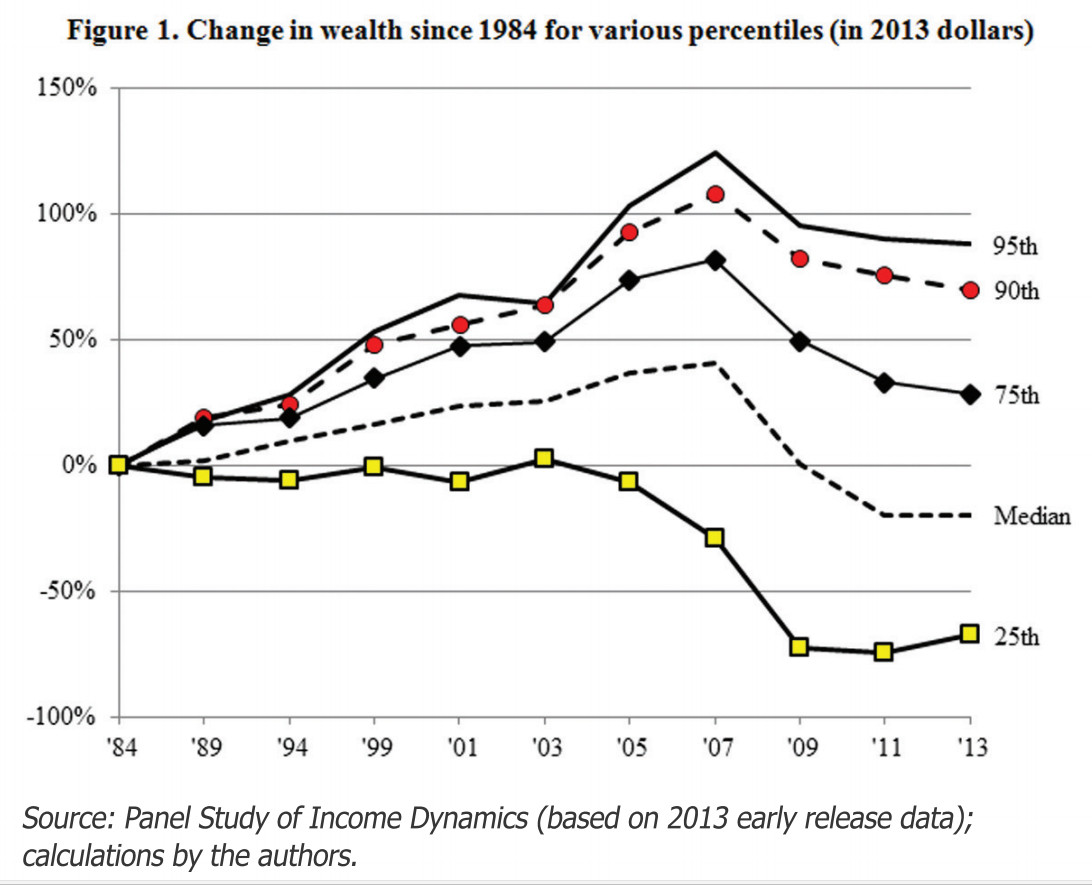
Median wealth -- a proxy for the wealth of the middle class -- has fallen 20 percent since 1984.