
Young people are taking longer to launch their careers, but it's not totally their fault, a report released Monday from Georgetown University's Center on Education and the Workforce, found.
"What we see here is it's the economy, not attitudes," Anthony Carnevale, the director of the Georgetown center, told The Huffington Post. Young job seekers are having trouble finding work and making money because of structural changes that have been taking place for some time, according to the report.
Here are 7 charts from the report that illustrate some of the most frightening trends.
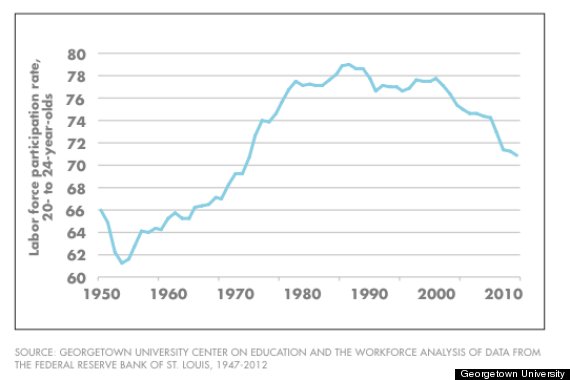
The share of young people in the labor force is at its lowest point since 1972.
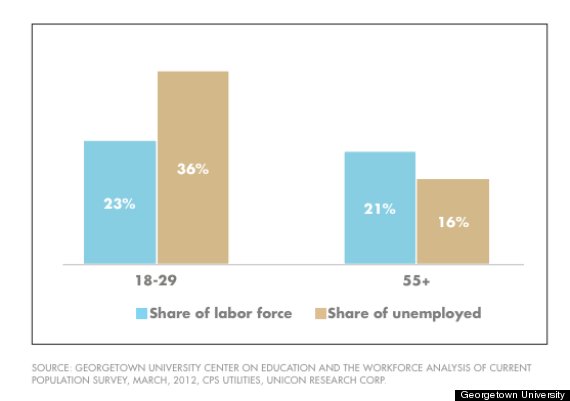
The situation is so bad that young people make up a much larger share of America's unemployed population than they do of the nation's workforce.
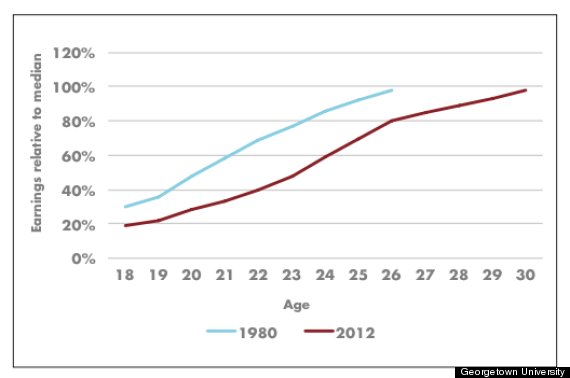
For the young people who are lucky enough to have jobs, it's taking longer than ever to start earning the median wage. In 1980, the average worker hit the median wage at 26, now that number has gone up to 30.
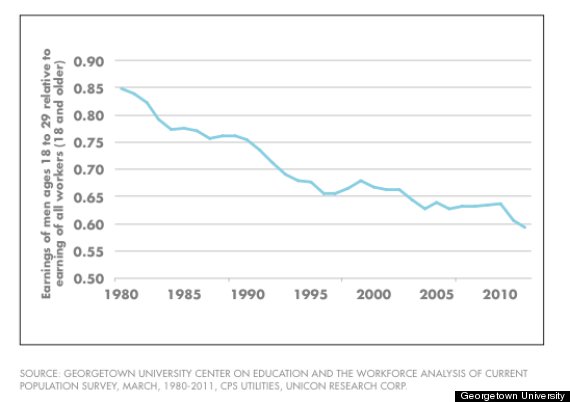
And the earnings of men ages 18 to 29 have been declining relative to the earnings of everyone else since 1980.
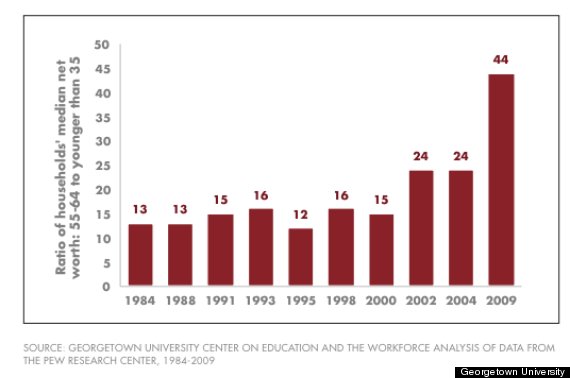
The result is that it's getting harder for young Americans to build up any wealth. Older Americans had 44 times as much wealth as younger Americans in 2009. That's up from 13 times as much wealth in 1984.
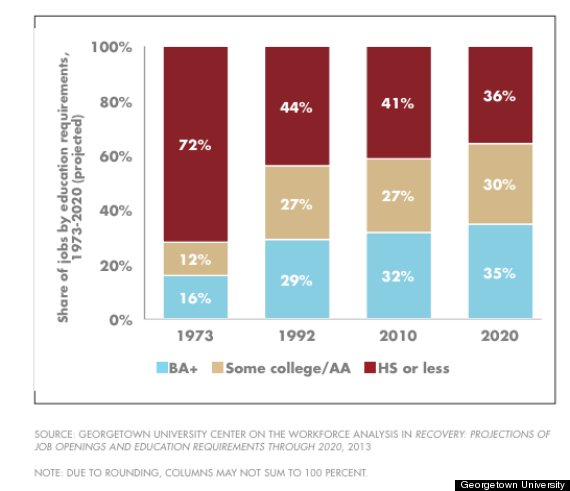
And the job market is bound to get even more competitive. By 2020, more than 65 percent of jobs will require a degree beyond high school.
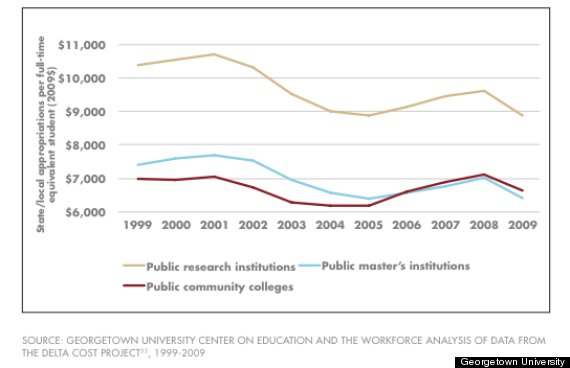
This is especially troubling because government spending for higher education has been on the decline since 1999.
Related
Before You Go
