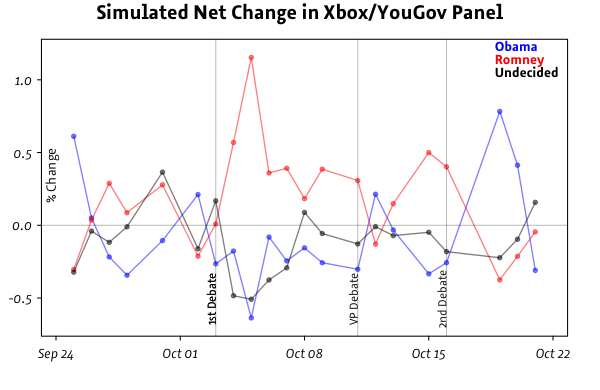
Confused by the incredible movement and variation in the daily stream of national popular vote polls? The Xbox/YouGov panel is your antidote to the noise; the panel paints a very clear picture of how the vote intentions of Xbox LIVE users have changed over the past three weeks. After the first presidential debate on Oct. 3 there was a record jump in respondents switching toward support for Romney and that rise in support persisted for a few days. The vice presidential debate stopped the bleeding for Obama and the second presidential debate on Oct. 16 gave Obama a few strong days. During this entire time the number of undecided voters has slowly drifted downward.
For each day between Sept. 24 and Oct. 21, we estimated the percentage change in support for each candidate. This estimate is based on people who were interviewed on a particular day and at least once in the preceding five days, so that they reflect the actual changes of individual voters, not aggregate changes in different samples of voters. The change is calculated by computing the percentage of persons giving each possible response (Obama, Romney, Undecided, Other) in their most recent interview and the percentage distribution of the same voters on the current day. The percentage change is the difference of these two percentages, weighted by the baseline proportion in each group. We have been polling Xbox LIVE users on their voter intention continuously since Sept. 22. There is an average of 6,502 paneled users reflected on a given day and a total of 40,988 at some point since September 24.
 >
>
This chart is not nearly as dramatic as what recent national telephone polls have shown, with wide swings following the first presidential debate, despite there being relatively few undecided voters in most polls. For example, Obama was leading by eight points in Pew's September survey and trailing by four points in Pew's October survey conducted shortly after the first presidential debate. Similarly, Gallup's tracking poll from Sept. 27 through Oct. 3 had Obama leading by four points and it now has him trailing by one point among registered voters and six points among likely voters. Our daily tracking poll shows similarly dramatic changes.
Most polls, including the ones noted above, are based on new samples for each new poll. When you compare two polls, even from the same pollster, the difference depends on the samples being the same. If the composition of the samples change, the polls may give a misleading indication of how much movement there really is. Although these are labeled "probability samples" or "probability-based samples," the response rates are typically 10 percent or less, so most of the probability comes from the likelihood that a respondent chooses to participate, not the chance of selection.
By comparing the distribution of background variables in different polls, it is easy to see that the same people, or even the same type of people, are not responding repeatedly. For example, respondents to the September Pew poll reported voting 47 for Obama and 32 for McCain, while respondents to the October Pew poll voted 42 for Obama and 37 for McCain. Where did the 2008 Obama voters go?
No one would claim that our panel is a representative sample of the population -- the poll respondents are overwhelmingly male and a majority under 30 -- but, we have the advantage that (a) we interview a lot of people every day, and (b) the same people participate multiple times per week. So we have a large population of the same people, telling us how they plan to vote repeatedly. We can observe real change in this audience, rather than trying to infer change from different samples with unknown characteristics. And, with so few people switching support during the course of an election, it takes a massive sample to record the quantities we observe.
We should not be surprised that the number of McCain supporters surged in the October Pew poll relative to the September Pew poll; selection bias is a serious issue in polling. Imagine that you are an Obama supporter belonging to demographic group X and Pew randomly picks to call you a few days after Romney's 47 percent video came out. You would be totally stoked to answer and tell them how much you love Obama. Now imagine Pew randomly picks to call you a few days after Obama's disastrous first debate. This time, you avoid the phone call and the person that replaces you might share your demographics but is a Romney supporter that is more than happy to sing Romney's praises. In that scenario, a shift in the polls reflects enthusiasm and cooperation, as much or more than an actual shift of support.
You can learn a lot about what's going on with large, high frequency data collection from a self-selected and non-representative population. We understand that there is a lot more research to go, but even at the very start this new venture we are seeing meaningful and relevant trends in regard to the 2012 election.
If you have an Xbox, please participate in our daily polls on Xbox LIVE and do not forget to watch the debate tonight live on your Xbox and participate in our within debate polling!