
So, at the end of a day when Twitter was alive with the sound of pundits railing against poll averages (well, one poll average or even one poll averager in particular), I thought I'd try this.
I've simply taken every poll in nine battleground states over the last two weeks from Pollster's data base, converting the reported result to a two-party result. The states are CO, FL, IA, NC, NH, NV, OH, VA and WI. I've then made a graph with each data point covering area proportional to the sample size of the poll, stacking the polls on top of one another, to give a visual sense of where the weight of the evidence lies; I rounded the two-party results to make the vertical stacks. The labels indicate the state.
No house effects. No modeling. Just the data.
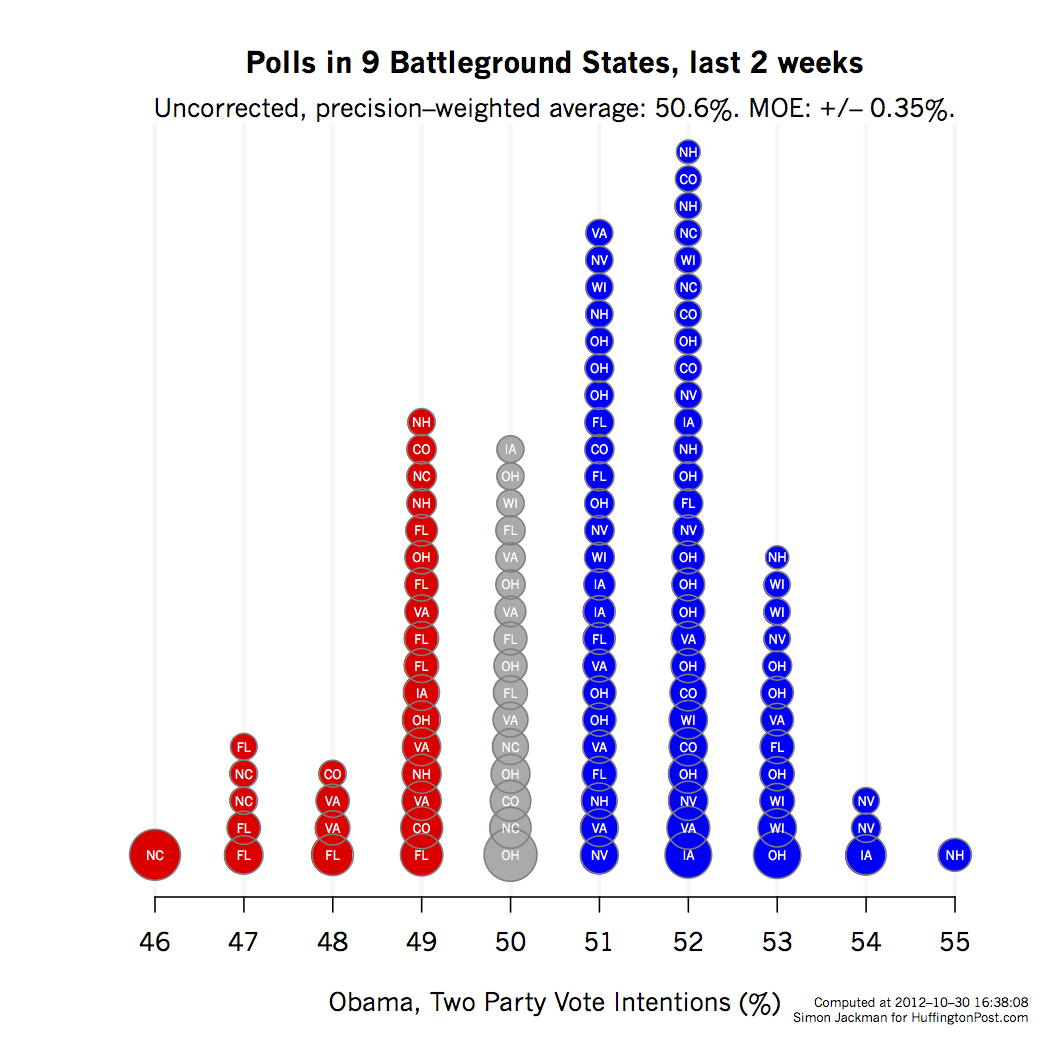
The precision-weighted average of these 110 polls (yes, 110!) is 50.6 percent two-party vote share for Obama, with a margin of error of just +/- 0.35 percentage points. That is, given these data, we're extremely confident Obama is polling north of 50 percent, at least averaged over two weeks of polls across these nine states.
99.97 percent sure.
We're not making this stuff up.
Obligatory tech notes: "Precision" = 1/variance; the variance of a proportion p estimated with n observations is p*(1-p)/n. A precision-weighted averaged (PWA) of the polls is formed by summing the poll results (each weighted by its precision) and then dividing by the sum of the poll-specific precisions. The precision of the PWA is the sum of the poll-specific precisions. The variance of the PWA is the inverse of the summed precisions. The standard deviation is the square root of this variance; the MOE is plus or minus 1.96 standard deviations. The probability that Obama's PWA is above 50 percent is the area under a normal density lying to the right of 50 percent, where the normal density is centered at the PWA (50.62 percent) and has standard deviation 0.1775 percentage points.