
As we stride, or stumble, forward into a new decade we are burdened by several significant imbalances inherited from the recent past. These imbalances will be addressed either by policy, or in panicked responses to threatening disasters. One of the most powerful lessons of the last decade is that imbalances left to grow blossom into serious crises. The tech/telecom bubble, the housing debt bubble, growing inequality, health care, the trade deficit, the government budget deficit, industrial policy, environmental policy ...
The new decade affords an opportunity to screen our baggage and decide what we do and don't want to bring with us as we travel into the future. Below is a cursory overview of some leading imbalances that can be addressed.
The US Trade Balance has been dramatically negative for many decades. Our average annual trade deficits doubled many times across the last 2 decades. In the early years of the new millennium we were importing about $1 billion more than we were exporting in goods and services every single day. By 2008 we were importing more than $2billion more than we were exporting every single day. This is how our trade deficits ballooned from around $100 billion per year in the 1990s to around $700 billion per year by the middle of the last decade. We have been reducing savings, selling assets to and borrowing from the rest of the world at between $1 billion and more than $2 billion every day for over a decade. This is a tremendous imbalance. We are long past the point of pretending this is not influencing our lives, jobs, politics and place in the world.
The US Net International Investment Position (NIIP) is another way to measure this process. The NIIP adds up all the foreign assets owned by Americans and subtracts all the American assets owned by foreign interests. It is a measure of how much of the world America owns versus how much of America the world owns. The NIIP was positive until 1986, America owned more of the rest of the world than the rest of the world owned of America. We went negative in 1986 and never looked back. In 1990 our NIIP was negative$225 billions. In 2000 it was negative $1.3 trillion. As we started 2009, the NIIP is a negative $3.5 trillion.
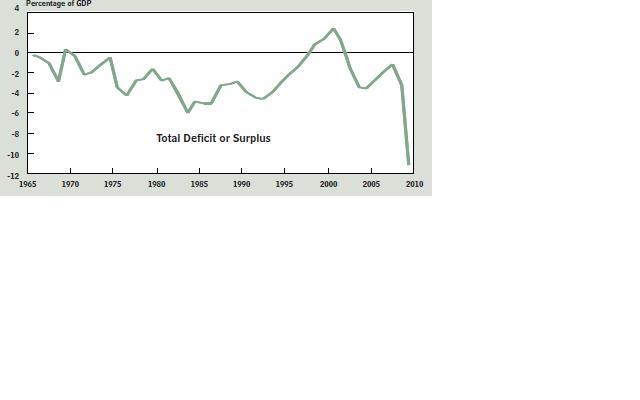
Government Budget Deficits have been large and growing for many decades. The chart below is taken from the Congressional Budget Office (CBO) and is worth trillions of words and Dollars as an image. This is not a rant against the government or an indictment of aid programs. It is high time we moved away from ideological generalities about "the government." As soon as we reground debate it will be clear that we simply cannot spend at the present levels indefinitely without raising revenues and cutting costs. Government deficit spending can be an essential tool to get out of recession driven by large and sudden declines in private economic activity. Perpetual and massive budget deficits are another story.
Rising inequality has been with us since the mid 1970s. For the better part of the last 4 decades we have seen a nearly constant rise in inequality. One in eight American adults and nearly one in four American children relay on food stamps at some point in the year. The US Census reported in 2008 that the number of Americans in poverty has jumped in the present recession. 40 million Americans, nearly 14% of the total population, live at or under the very, very low Federal poverty level. Over 50 million Americans, nearly 18% of the US population, live in households that earn less than 125% of the poverty income level. Real median US household has not risen since the late 1990s. The US Census tells us that the middle 20% of Americans took home 17% of the nation's income in 1974 and 14% of the nation's income in 2008. The wealthiest 20% of Americans took home 43% of the nation's income in 1974 and 50% of the nation's income in 2008. The poorest 20% of Americans were struggling to get by on 4.3% of the nation's private income in 1974; today they have 3.4% to work with. The wealthiest 1 on five Americans takes home 14.7 times the share of income taken home by the poorest 1 in 5 Americans.
This list could be extended and future articles will take up some of the imbalances left out here. The above three central imbalances will define and reduce our prosperity if we do not begin to confront and respond to them. All of these imbalances figured into the last 10 years being the first to see no increase in wages, stock market performance or prosperity in America. We can't afford another lost decade. The new decade and easing of the downturn's speed and ferocity offer as good an opportunity as we are likely to see. 2007-2009 taught us a harsh lesson in what happens when structural economic problems are ignored.