

Is the latest Newsweek poll "fishy?" As we reported yesterday, their latest sample of registered voters split evenly on the question of whether they plan to vote for a Democrat or a Republican for Congress this year. Over the weekend, Todd Eberly, an assistant professor of political science at St. Mary's College of Maryland, argued that the poll seemed "fishy" and "cooked." Jim Geraghty gave Eberly's post a plug on National Review Online and, as a result, commenters on my report on Pollster.com have been howling with outrage that we gave any credence to a "dishonestly weighted" poll.
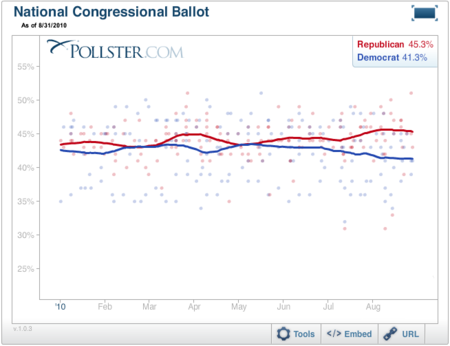
As I noted yesterday, the Newsweek poll did produce a result on the more positive end of the bell curve for Democrats. Make no mistake: A simple average of recent polls (including Newsweek) shows a roughly five-point Republican advantage on the so-called generic House ballot -- a result that points to Republicans winning 50 or more seats and with it, control of the House. Moreover, the trend is moving in the Republican direction. So no one should interpret anything that follows as evidence that "all is well" for the Democrats.
If Eberly had confined his criticism to Newsweek's headline and story, which focused only on the Newsweek poll and thus concluded that Democrats "may not be headed for a bloodbath," I would be sympathetic. But Eberly goes much farther and alleges that the data are "fishy," that "someone at Newsweek cooked the books and hoped we wouldn't notice."
On that score Eberly has his math -- and the facts -- flat wrong.
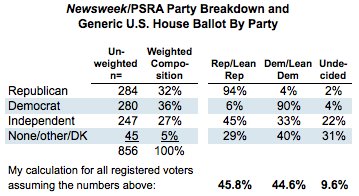
The crux of his argument -- the evidence that he oddly alleges the Newsweek pollsters hoped we wouldn't notice -- appears at the very top of the "complete poll results" document produced by Newsweek's polling firm, Princeton Survey Research Associates (PSRA; interests disclosed: PSRA CEO Evans Witt is a neighbor and friend). Because they provide results for the entire survey tabulated by party identification, PSRA also discloses the unweighted sample sizes for all the party subgroups, Democrats (280 registered voters), Republicans (284) and independents (247) as well as the total of all registered voters interviewed (856).
Eberly finds that partisan mix inconsistent with the results that Newsweek reports for the generic ballot. "[I]t is mathematically impossible," he writes "for Democrats and Republicans to be tied at 45%" given that party breakdown.
Well of course it is. The party breakdown is unweighted. PSRA also discloses, on the same front page of their questionnaire, that their data are "weighted so that sample demographics match Census Current Population Survey parameters for gender, age, education, race, region, and population density."
Now in fairness, PSRA's report does not explicitly say that the subgroup sample sizes are unweighted -- an omission which often leads to this sort of confusion -- but they do provide weighted results for party identification at the end of their report. Among registered voters the weighted result is 32% Republican, 35% Democrat, 29% independent and the rest volunteering that they have no party (5%), are a member of another party (1%) or are unsure (3%).
"Now it's possible," Eberly concludes, "that after weighting for gender, age, education, race, region, and population density the partisan ID of the sample would change."
Yes. It's also likely. Any national pollster will tell you that weighting a sample of adults to match census statistics will typically make the sample a few points more Democratic. The four-point shift seen on this survey is slightly bigger than usual, but that's the way random variation works.
Newsweek does not weight it polls by by party. They weight their adult samples demographically and then, in this case, report on the results among registered voters. Most national media pollsters use the same procedure. A simple Google search on "weighting by party ID" will quickly yield a full explanation and more.
But Eberly is having none of that. His smoking gun? When he enters Newsweek's results-by-party ballot into a spreadsheet, and plugs in the "reported [party] breakdown" (36% Democrat, 32% Republican), he can't reproduce the 45% to 45% tie on the they report on the generic House ballot. By his calculations, "the Republicans still lead by 47.4% to 42.6% -- [so] the poll is pure nonsense."
Professor Eberly? Did you notice that the the unweighted sample sizes of Democrats (280), Republicans (284) and independents (247) add to just 811, not the 856 registered voters that Newsweek reported?* Did you wonder why? Did it occur to you that your tabulations *omitted results for 45 interviews conducted among the registered voters whose answers were "other," no party or unsure and that the omission might explain why your calculations don't match what Newsweek reported?
Apparently not.
Now there's nothing unusual about Newsweek's omission. Few public pollsters report results for subgroups of less than 100 interviews, and for good reason. The margin of error on 45 interviews would yield a margin of error of at least +/- 15%. But I asked PSRA to make an exception in this case and they kindly disclosed that the 45 other/none/unsure respondents support the Democratic candidate in their District rather than the Republican by a 40% to 29% margin. Put those numbers into a spreadsheet along with the rest of the result-by-party, apply the weighted party composition reported at the end of the questionnaire (36% Democrat, 32% Republican, 27% independent, 5% other/none/unsure), and I get a result on the generic ballot of 45.8% Democrat, 44.6% Republican. The slight difference from the 45% to 45% reported by Newsweek is likely due to the rounded numbers we plugged into the spreadsheet.
Eberly calls on Newsweek "to release fully the effects of it's weighting." I have no idea what he means, but readers should know that Newsweek discloses more about its weighted and unweighted party identification results than most pollsters. Can you point to any Rasmussen poll of registered or likely voters, for example, that discloses either its unweighted or weighted party identification breakdown?
Now again, the results of this Newsweek's poll are arguably on the optimistic end of the bell curve for Democrats, but given the reported +/-4% margin of error, the 45%-to-45% result does not differ significantly from our 45.6% Republican to 41.1% Democrat trend estimate (as of this writing) based on all available public polls.
The charge that Newsweek and PSRA intentionally "cooked the books and hoped we wouldn't notice" is nonsense. Eberly owes them a retraction and an apology.
**Hat tip to Pollster reader John who did notice the discrepancy.