

Bouncing Back
After suffering a negative month in the polls in March, President Obama bounced back in April, gaining back all the ground he had lost and then some (well, "and then a little bit more" would be more accurate...). He still hasn't quite made it back to where his poll numbers were before the Obamacare website rollout, but if the trendlines continue in May, he is at least within reach of this goal for the first time since last October. Let's take a look at the updated chart, shall we?
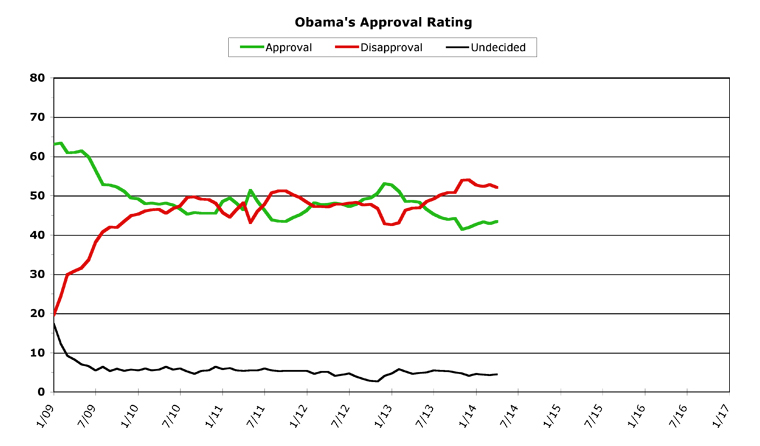
[Click on graph to see larger-scale version.]
April 2014
President Obama started April on a positive note as the Obamacare numbers were revealed, and the news just kept getting better all month long on this front. Surprising just about everyone, the White House announced that they had indeed met the initial goal of over 7 million signups, and subsequent weekly releases pushed this number to 7.5 million and then finally to over 8 million. This represented a strong success, and Obama's public job approval polling numbers reflected the good news.
Foreign policy news was nowhere near as rosy as the situation in Ukraine steadily deteriorated, but the American public showed not much interest in any sort of military support, so it didn't really affect Obama's approval much (if at all). Obama took a trip abroad, but again not many Americans paid all that much attention. The public spotlight was on a few high-profile incidents of unreconstructed racism, but this didn't really affect the political scene much either.
Obama's monthly average job approval rating rose a half of a percent in April, to wind up at 43.4 percent approval -- which reversed the 0.4 percent drop he saw in the previous month. Obama's monthly average disapproval fell by 0.7 percent, to wind up at 52.1 percent for April. This followed a 0.5 percent rise in March, meaning that in both the approval and disapproval categories Obama regained all the ground he had lost in the previous month, plus an extra 0.3 percent. This puts him back on a positive trajectory since his low point at the end of last year. Since November, his approval rate has risen 2.0 percent, and since December his disapproval rate has fallen 1.9 percent. He still has to gain roughly one more percent in both categories, though, to be at the point he was before the Obamacare rollout fiasco.
Overall Trends
Before we get to examining the trendlines, we've got a bonus chart this week. I was playing around with the possibility of adding a few crucial turning points to the presidential approval charts, because it's easy to forget exactly what was going on politically at each point, when viewing these overviews. This is just a first effort, but here's what I've got so far for Obama:
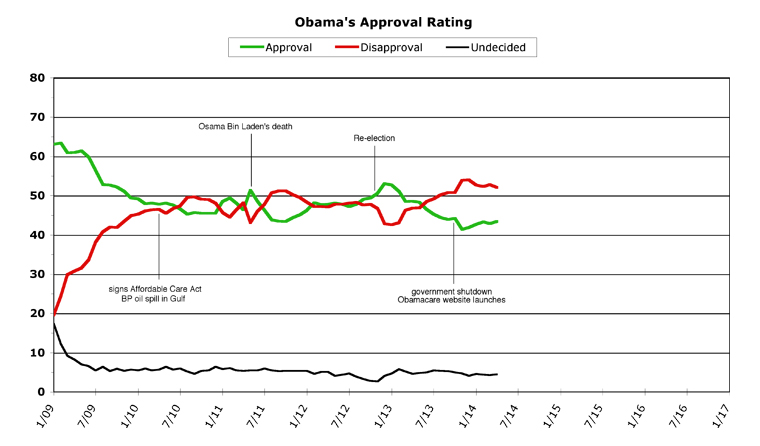
[Click on graph to see larger-scale version.]
So, what do you think? Is this sort of thing useful? Could it use a few more data points? Any suggestions for events to add to provide a clearer picture of the context of these approval ratings? Let me know in the comments.
Actually, we have two bonus charts this week, although the following is one that has appeared before. It zooms in on the past year, and presents a much more detailed scale, to see the movements up and down more clearly. Since we haven't run one of these in a while, we thought it'd be worth taking a magnified look as we discuss the trends.
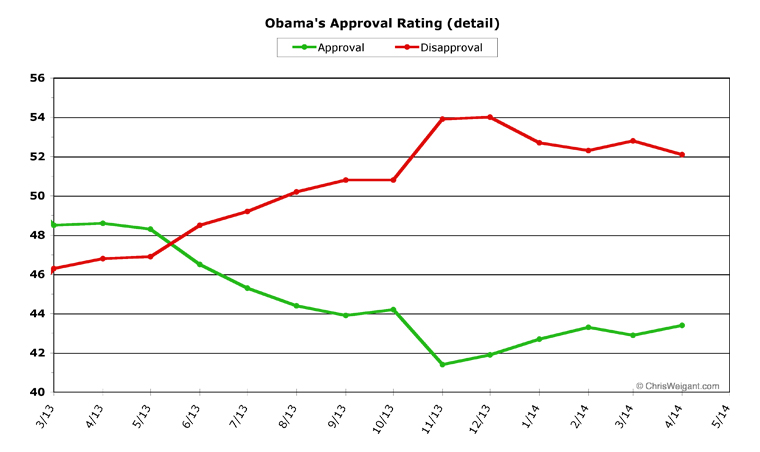
[Click on graph to see larger-scale version.]
The overall trends for Obama are pretty good right now, but could always change (it is, after all, an election year). As is plainly visible in the detail chart, Obama still has a little less than a percentage point to gain in approval (and a little more than a percent in disapproval) before he'll be back to where he was before last October's major drop. And even then, he still won't be in a very comfortable place, as this is roughly the same as the lowest point he ever reached during his first term.
But he is moving in the right direction again, at least. Measured a bit differently, the gap between his approval and disapproval rating is now 8.7 percent "underwater" (where disapproval is higher than approval), but this is down from last month's 9.9 percent -- and down significantly from Obama's all-time high of a 12.5 percent gap, last November. To put this in perspective, however, the worst point he ever got in his first term was only 7.8 percent underwater (in October, 2011).
When you look within the daily averages, though, the trendline looks even more positive. Obama started the month with the same daily job approval as he charted for a monthly average in March (42.9 percent), and although he briefly dipped below this on the 12th of the month (42.6 percent), by the 21st he had hit a high of 44.7 percent. This fell back a bit at the end of the month, but overall his daily numbers are headed slowly upwards. His daily disapproval numbers were even clearer, falling from a monthly high hit on the first day of the month (52.9 percent) to a low of 50.8 percent on the 21st.
May is shaping up to be a pretty good month for Obama on the domestic front, at least. The improving unemployment numbers should have an effect on his polling, and the great signup numbers for Obamacare have significantly blunted Republican attacks with the public at large. The 2014 midterm season is going to heat up this month, as the primary results begin to come in from more and more states.
While it is entirely possible that April's numbers are just (as I suggested last month) a flattening out of Obama's polling numbers to a "new normal," the trends -- for the time being -- point to a more positive outcome. Obama will likely not make huge gains in May, but the safest bet at this point is that he will continue to slowly improve to finally reach the point his numbers were at before the Obamacare website rolled out (roughly: above 44 percent approval and below 51 percent disapproval).
Even though this is fairly optimistic news for Obama fans, it must be pointed out that the larger picture is still not all that great. His polling numbers won't really be headed for recovery until he's above 45 percent approval and below 50 percent approval, and he won't have truly recovered in the ratings until his approval is back above his disapproval rate ("above water" once again) -- and that could take quite awhile, even with the positive trends he is now showing. Just to put things in perspective.
[Obama Poll Watch Data:]
Sources And Methodology
ObamaPollWatch.com is an admittedly amateur effort, but we do try to stay professional when it comes to revealing our sources and methodology. All our source data comes from RealClearPolitics.com; specifically from their daily presidential approval ratings "poll of polls" graphic page. We take their daily numbers, log them, and then average each month's data into a single number -- which is then shown on our monthly charts here (a "poll of polls of polls," if you will...). You can read a much-more detailed explanation of our source data and methodology on our "About Obama Poll Watch" page, if you're interested.
Questions or comments? Use the Email Chris page to drop me a private note.
Obama's Second Term Statistical Records
Monthly
Highest Monthly Approval -- 1/13 -- 52.7%
Lowest Monthly Approval -- 11/13 -- 41.4%
Highest Monthly Disapproval -- 12/13 -- 54.0%
Lowest Monthly Disapproval -- 1/13 -- 42.6%
Daily
Highest Daily Approval -- 1/31/13 -- 52.5%
Lowest Daily Approval -- 12/2/13 -- 39.8%
Highest Daily Disapproval -- 12/2/13 -- 55.9%
Lowest Daily Disapproval -- 2/24/13 -- 42.3%
Obama's Second Term Raw Monthly Data
[All-time high in bold, all-time low underlined.]
Month -- (Approval / Disapproval / Undecided)
04/14 -- 43.4 / 52.1 / 4.5
03/14 -- 42.9 / 52.8 / 4.3
02/14 -- 43.3 / 52.3 / 4.4
01/14 -- 42.7 / 52.7 / 4.6
12/13 -- 41.9 / 54.0 / 4.1
11/13 -- 41.4 / 53.9 / 4.7
10/13 -- 44.2 / 50.8 / 5.0
09/13 -- 43.9 / 50.8 / 5.3
08/13 -- 44.4 / 50.2 / 5.4
07/13 -- 45.3 / 49.2 / 5.5
06/13 -- 46.5 / 48.5 / 5.0
05/13 -- 48.3 / 46.9 / 4.8
04/13 -- 48.6 / 46.8 / 4.6
03/13 -- 48.5 / 46.3 / 5.2
02/13 -- 51.1 / 43.0 / 5.9
01/13 -- 52.7 / 42.6 / 4.7
Second Term Column Archives
[Mar 14], [Feb 14], [Jan 14], Dec 13], [Nov 13], [Oct 13], Sep 13], [Aug 13], [Jul 13], [Jun 13], [May 13], [Apr 13], [Mar 13], [Feb 13], [Jan 13]
First Term Data
To save space, the only data and statistics listed above are from Obama's second term. If you'd like to see the data and stats from Obama's first term, including a list of links to the full archives of the Obama Poll Watch column for the first term, we've set up an Obama Poll Watch First Term Data page, for those still interested.
Chris Weigant blogs at:
Follow Chris on Twitter: @ChrisWeigant
Become a fan of Chris on Huffington Post
Full archives of OPW columns: ObamaPollWatch.com