
Bold moves begin to pay off
Barack Obama's job approval polling numbers, at times, seem to follow seasonal trends. He usually loses ground in the summer, particularly in August. In winter, however, he usually gains ground. This year Obama seems likely to repeat this pattern, if December's numbers are any indication.
Obama had a good month in December's polling, and everything points to his numbers improving even more dramatically in January. Ever since the midterm election, Obama has been making bold political moves, and it seems they are starting to pay off in rising public support. But before we look at the larger trends, let's take a look at this month's numbers first.
[Click on graph to see larger-scale version.]
December, 2014
A lot happened in the political world in December, but much of it had nothing to do with Obama, at least in the public's eyes. A lame-duck Congress passed the "cromnibus" bill which will avoid government shutdowns for a full year (except for Homeland Security, which will be battled over in February). Obama pushed to get it through, earning the scorn of some Democrats, but most of the public didn't even notice the bill's passage. Dianne Feinstein released her long-awaited torture report, but it was seen as very old news (it might affect George W. Bush's approval ratings more than Obama's, to put this another way). George's brother Jeb is getting ready to run for the 2016 Republican nomination, but again this didn't affect Obama in the least.
There were three big stories that did directly affect Obama, though. Obama began the month with some extremely good economic news, when the monthly unemployment report was released. He then surprised all of Washington (and the rest of the country as well) by announcing the end of a half-century-long failed policy towards Cuba, which the public is overwhelmingly in favor of doing. Obama also dealt with the Sony hack pretty decisively (rightly or wrongly, this is how the public perception went) by taking down North Korea's web access within days. Now, the facts aren't all known about either the Sony hack or the response, and may never fully be. Nevertheless, Obama seems to have gotten a certain amount of "rally 'round the president" effect in the polling at the end of the month. Perhaps it was just seasonal goodwill, though.
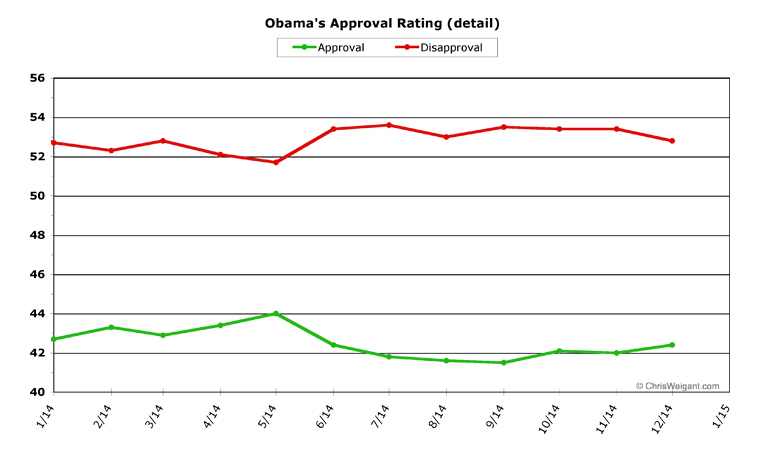
In December Obama's average monthly job approval rose 0.4 percent, to reach 42.4 percent. His average monthly job disapproval fell even more, down 0.6 percent to 52.8 percent. These are the best numbers Obama has posted since May, for context. Obama did well throughout the month, as some of his bold actions are now gaining him back supporters who may have abandoned the president earlier in the year. He started the month in good position and had an early good spike in his daily polling averages (his approval reached 43.3 the first week in December, the highest it would hit all month). But then when his numbers dipped the next week, even the lowest daily numbers he charted (41.8 approval, 53.4 disapproval) were still better than November's averages. By the end of the month, he was back to the high end of the range again, which bodes well for January.
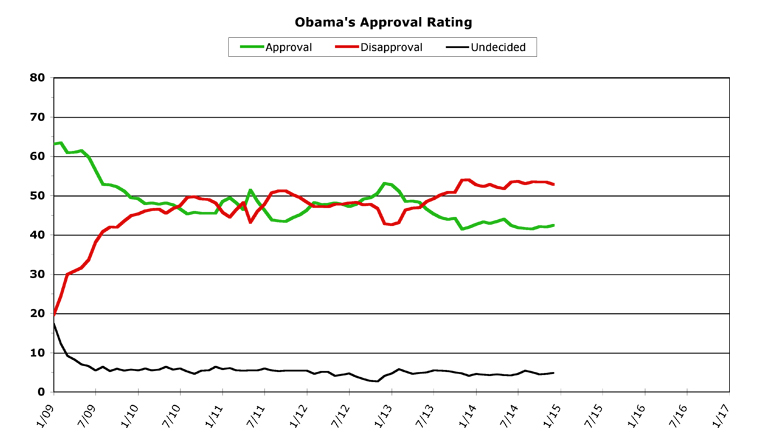
Overall Trends
The overall trends for Obama's polling are excellent, for the most part. He is poised to chart a big spike upwards in his averages in January, perhaps beating his numbers for all of 2014. Before we look forward to this new trend, however, let's take a quick look back at 2014 -- the flattest year Obama has ever charted. We've mentioned this previously, but for all the talk of "Obama's poll numbers are tanking" over the course of the past year, they actually stayed remarkably stable. His numbers started out pretty bad, but they didn't improve or deteriorate much at all for the entire year. So "Obama's poll numbers are still pretty bad" was correct, but "Obama's poll numbers are tanking" simply was not.
Here's an expanded look at just the last year, to see how stable Obama's numbers stayed:
[Click on graph to see larger-scale version.]
As you can see, Obama went through a lazy sine wave all year long, first up a bit then down a bit and slowly coming back up. In fact, he ended the year almost exactly where he began it -- last January's monthly averages were 42.7 approval and 52.7 disapproval. Obama closed out December with 42.4 percent and 52.8 percent, respectively. That is unbelievably close, for an entire year chock full of politics. In the past year, Obama hit his high points in May, when he managed 44.0 percent approval and 51.7 percent disapproval. He managed to not hit an all-time worst monthly showing in both categories all year long, although only by the skin of his teeth. Over the course of the year, Obama's monthly approval rating improved in six of the months and fell back in the other six -- about as even as you can get. He did slightly better in disapproval, improving in seven months, losing ground in only four, and not moving at all during one month. Overall, it was about as stable a year as can be imagined in public polling.
OK, enough context, let's look forward instead. Now, I'm not going to cast aspersions on RealClearPolitics, where we get our data for the daily averages for these charts. After all, the last week of the year is pretty hectic for everyone, and so they might have just not had much opportunity recently to update their own data set. But instead of only going back roughly two weeks (as they normally do), as of this writing they've still got polls listed from early December in their rolling average. The reason this is significant is because Obama has dramatically improved in the past two weeks or so. Which is why the trendline for January is looking so good right now. Take the individual polling numbers posted since the middle of the month -- approval (48, 37, 41, 48, 49) and disapproval (50, 54, 56, 48, 49). These average out to 44.6 percent approval and 51.4 percent disapproval. But because the older data is still being added in, Obama's daily averages are officially only 43.2 percent and 52.3 percent, respectively. That's a significant difference. If Obama held this average all month long, he'd wind up gaining 2.2 percent on approval and 1.4 percent on disapproval. This would be the best month Obama would have since December of 2012, right after he got re-elected (his "second honeymoon" period).
Of course, that's all hypothetical for the moment. But what isn't hypothetical is the rise in Obama's polling in the past few weeks. As I stated, he's almost always had a good run in the wintertime. Of the six Decembers he's been in office, he has only ever lost ground in one of them (2009, during the slide downwards from his first honeymoon period). And usually when Obama improves in December, he rides a wave of improvement through at least January and February. This could play out again in 2015.
In general, Januaries are favorable to just about any president (barring unforeseen crises, of course), because they get to end the month with the biggest presidential speech of the year -- the State Of The Union. The new Congress will get sworn in, but they likely won't accomplish much before the night of the big speech (the contentious political battles will be fought in February and beyond, for the most part). The media is finally reporting on the improving economy, and next week the new unemployment numbers will be out. If they are as good as last month's (or better), it will likely be reflected in the growing consumer confidence and may help boost Obama's job performance approval with the public even more. Obama seems on track to post big gains in January, perhaps even bettering all his monthly scores for the entire past year. His numbers are still low in the absolute sense (no president wants to be below 45 percent approval, to state the obvious), but they sure seem poised to get a lot better very soon.
[Obama Poll Watch Data:]
Sources And Methodology
ObamaPollWatch.com is an admittedly amateur effort, but we do try to stay professional when it comes to revealing our sources and methodology. All our source data comes from RealClearPolitics.com; specifically from their daily presidential approval ratings "poll of polls" graphic page. We take their daily numbers, log them, and then average each month's data into a single number -- which is then shown on our monthly charts here (a "poll of polls of polls," if you will...). You can read a much-more detailed explanation of our source data and methodology on our "About Obama Poll Watch" page, if you're interested.
Questions or comments? Use the Email Chris page to drop me a private note.
Obama's Second Term Statistical Records
Monthly
Highest Monthly Approval -- 1/13 -- 52.7%
Lowest Monthly Approval -- 11/13 -- 41.4%
Highest Monthly Disapproval -- 12/13 -- 54.0%
Lowest Monthly Disapproval -- 1/13 -- 42.6%
Daily
Highest Daily Approval -- 1/31/13 -- 52.5%
Lowest Daily Approval -- 12/2/13 -- 39.8%
Highest Daily Disapproval -- 12/2/13 -- 55.9%
Lowest Daily Disapproval -- 2/24/13 -- 42.3%
Obama's Second Term Raw Monthly Data
[All-time high in bold, all-time low underlined.]
Month -- (Approval / Disapproval / Undecided)
12/14 -- 42.4 / 52.8 / 4.8
11/14 -- 42.0 / 53.4 / 4.6
10/14 -- 42.1 / 53.4 / 4.5
09/14 -- 41.5 / 53.5 / 5.0
08/14 -- 41.6 / 53.0 / 5.4
07/14 -- 41.8 / 53.6 / 4.6
06/14 -- 42.4 / 53.4 / 4.2
05/14 -- 44.0 / 51.7 / 4.3
04/14 -- 43.4 / 52.1 / 4.5
03/14 -- 42.9 / 52.8 / 4.3
02/14 -- 43.3 / 52.3 / 4.4
01/14 -- 42.7 / 52.7 / 4.6
12/13 -- 41.9 / 54.0 / 4.1
11/13 -- 41.4 / 53.9 / 4.7
10/13 -- 44.2 / 50.8 / 5.0
09/13 -- 43.9 / 50.8 / 5.3
08/13 -- 44.4 / 50.2 / 5.4
07/13 -- 45.3 / 49.2 / 5.5
06/13 -- 46.5 / 48.5 / 5.0
05/13 -- 48.3 / 46.9 / 4.8
04/13 -- 48.6 / 46.8 / 4.6
03/13 -- 48.5 / 46.3 / 5.2
02/13 -- 51.1 / 43.0 / 5.9
01/13 -- 52.7 / 42.6 / 4.7
Second Term Column Archives
[Nov 14], [Oct 14], [Sep 14], [Aug 14], [Jul 14], [Jun 14], [May 14], [Apr 14], [Mar 14], [Feb 14], [Jan 14], Dec 13], [Nov 13], [Oct 13], Sep 13], [Aug 13], [Jul 13], [Jun 13], [May 13], [Apr 13], [Mar 13], [Feb 13], [Jan 13]
First Term Data
To save space, the only data and statistics listed above are from Obama's second term. If you'd like to see the data and stats from Obama's first term, including a list of links to the full archives of the Obama Poll Watch column for the first term, we've set up an Obama Poll Watch First Term Data page, for those still interested.
Chris Weigant blogs at:
Follow Chris on Twitter: @ChrisWeigant
Become a fan of Chris on Huffington Post
Full archives of OPW columns: ObamaPollWatch.com