
Back Down To Earth
Before we get to this month's depressing news for Obama fans, we've got a few quick program notes. The Obama Poll Watch site is in the process of updating to reflect the new reality of Obama's second term, and this month we've managed to convert all the "Obama versus previous presidents" charts to more easily show two presidential terms on the same chart. Unfortunately, this meant we didn't have time to clean out the data section at the bottom of this column (by creating a static page for "Obama first term statistics"), so you'll have to put up with a mountain of data for one more month, sorry.
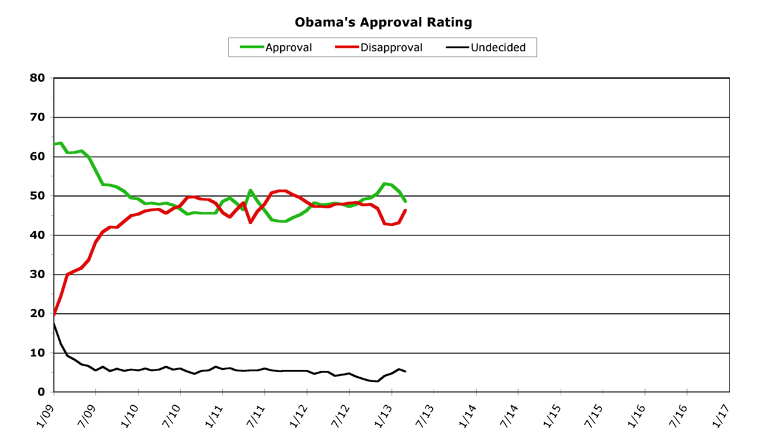
Ok, with that out of the way, let's have a look at March's polling. President Obama lost almost all the ground he had gained late in the 2012 election season, and his numbers fell back to where he was roughly six months ago. This isn't as bad as some media have made it out to be, since it may represent Obama's true natural level of support. But we're getting ahead of ourselves, let's take a look at this month's chart:
[Click on graph to see larger-scale version.]
March, 2013
March started out on a low note for Washington in general, as Congress sat and did nothing while the sequester took effect. At the beginning of the month, the media was running with the storyline that "Obama oversold the effects of the sequester," but as the budget cuts bite, you don't hear that much anymore. As the summer arrives, this will become more pronounced, as Americans see the tangible effects of the Republican "cut big government" philosophy in their lives.
Other news in March was somewhat removed from Obama -- the Catholic world getting a new pope, and the big gay marriage showdown at the Supreme Court. Both parties passed a budget document in their respectively-held houses in Congress, and Obama went on a "charm offensive" that may have opened doors to future negotiations and may also have been nothing more than a bunch of photo-ops. Time will tell. Rand Paul was in the news for mounting a "real" filibuster, and the head of the Republican Party released a 100-page "autopsy" of what went wrong for them in the 2012 elections (everything), and what they need to do to fix it (start cloning old white guys in red states, perhaps?).
But in March, the public noticeably gave up on all the election hype and hope, and returned to their general disgust with Washington. Which affected Obama tangibly. Obama's job approval numbers had the worst month they've had in quite a long time, in fact. His monthly job approval average fell 2.6 points, to 48.5 percent. His monthly disapproval average rose a whopping 3.2 points to end up at 46.3 percent. The only thing that stabilized in March was the number of undecideds, which actually fell from 5.8 to 5.2 percent. Obama hit a new low in approval and a new high in disapproval for his second term, as the honeymoon bounce completely evaporated.
About the only good thing you can say about Obama's poll numbers in March is that he's still "above water" -- but only barely, by a 2.2 percent margin -- since his approval, for now, is holding above his disapproval.
Overall Trends
But Obama fans shouldn't even take heart in his being above water, because the trend line is still heading down -- although it may have slowed. Obama charted a big drop at the beginning of the month, most likely in reaction to all the sequester news. He then stayed fairly steady throughout the middle of the month, but towards the end his approval numbers were inching down once again -- although, as noted, much slower than the big downward spike at the start of March. Obama's disapproval rose more steadily throughout the month, and seemed to stabilize a bit at the end.
April may provide much better political ground for Obama, however. The big debates in Congress are going to shift from the endless budget wrangling to putting two other issues on center stage: immigration and gun control. On guns, Obama is losing public support overall as time distances Americans from the Newtown tragedy. On some specific gun control reform (universal background checks), the public is still overwhelmingly supportive, but on larger issues (assault weapons ban) the public support is waning fast.
Immigration reform is probably the biggest chance for some political excitement in April, though. Obama and the Democrats are squarely on the right side of this issue with the public, and the possibilities for Republicans to shoot themselves in the foot with extremism are incredibly high (if not downright inevitable, at least over in the House). Once the Senate actually puts out a bill (expected next Monday), Obama has the chance to show some real leadership on the issue.
The only other possibility for Obama to gain back some job approval will come this Friday, when the March unemployment figures are released. March was a pretty good month, economists are saying, so if the data is positive, it may help Obama in the upcoming budget battles, and with general public approval.
The overall trend for Obama's job approval numbers right now is slightly downwards, but possibly slowing and bottoming out. Next month, his numbers may flatten out, but a big jump upwards is unlikely. If the news turns sour, though, his numbers could continue falling even further as the honeymoon effect of getting re-elected continues to fade away.
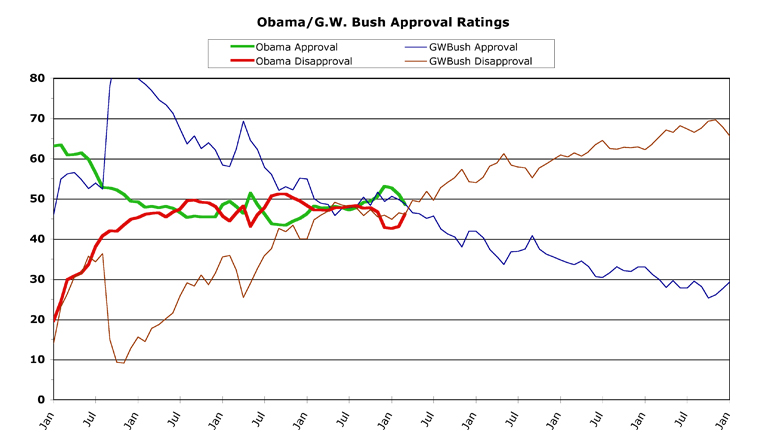
As if this news wasn't dismal enough for Obama fans, I have a bonus chart this week, showing Obama's numbers versus George W. Bush's. A quick glace at the chart shows why it's relevant:
[Click on graph to see larger-scale version.]
Obama and Bush seem to be at almost exactly the same point, in their respective presidencies. Obama right now is 48.5/46.3 and Bush was at 48.7/46.1 in March of 2005. This was precisely the point where Bush's public support collapsed altogether, for the rest of his time in office.
But in reality, this is not the likeliest outcome for Obama. The Iraq War was what really dragged Bush down (to say nothing of Katrina, later on, or the collapse of the American economy, at the end), and Obama already ended that. America getting involved with some endless war (Iran or North Korea, for instance) could conceivably drag Obama's numbers down in a similar fashion, but my guess is that Obama's numbers are going to flatten out and stay above 40 percent, at a minimum. In other words, while that's a scary chart to view the first time you see it, realistically I doubt Obama will follow Bush's second-term trend.
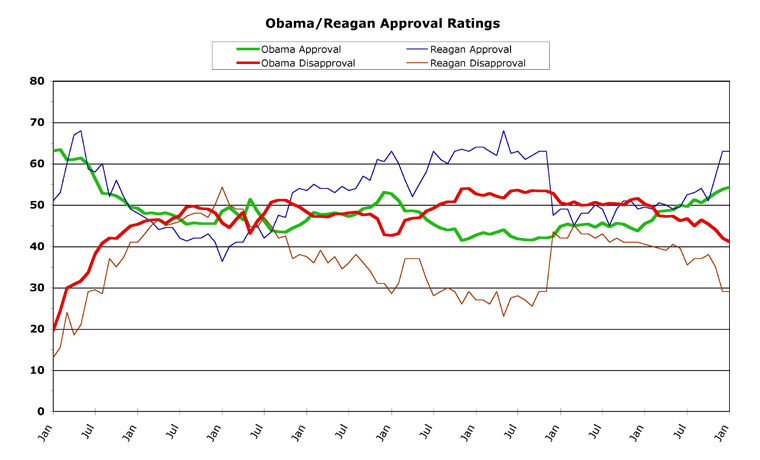
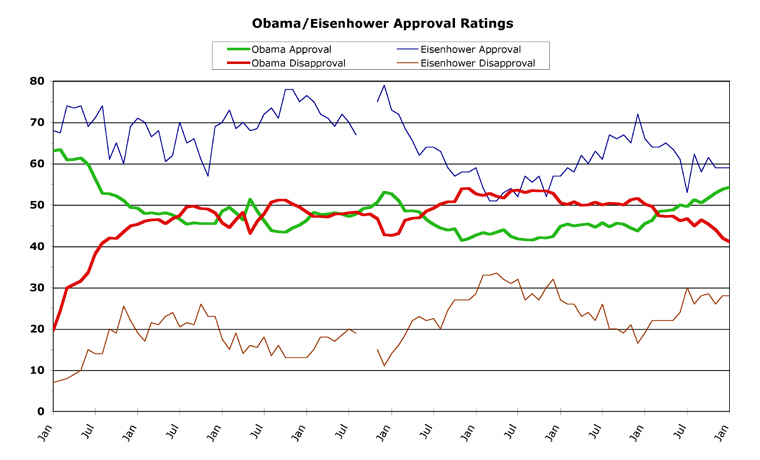
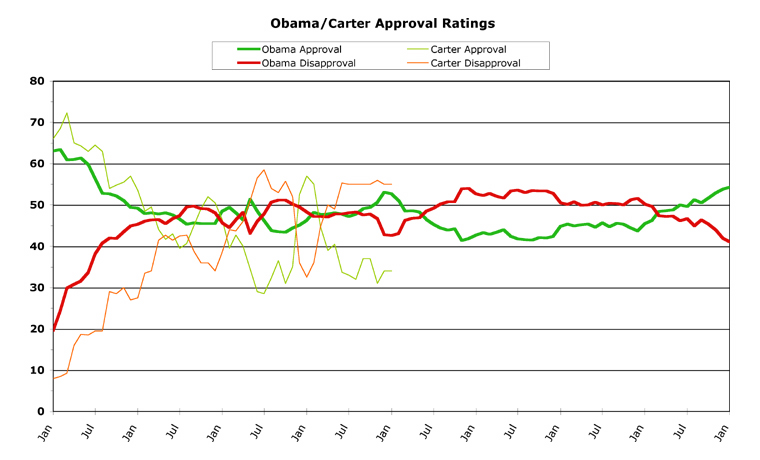
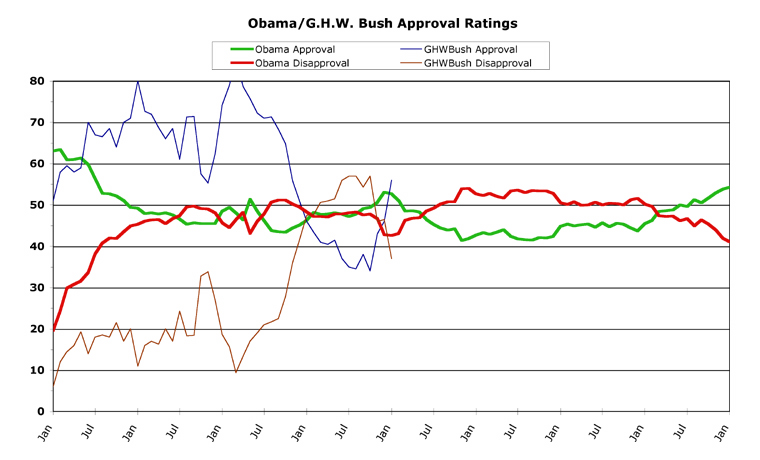
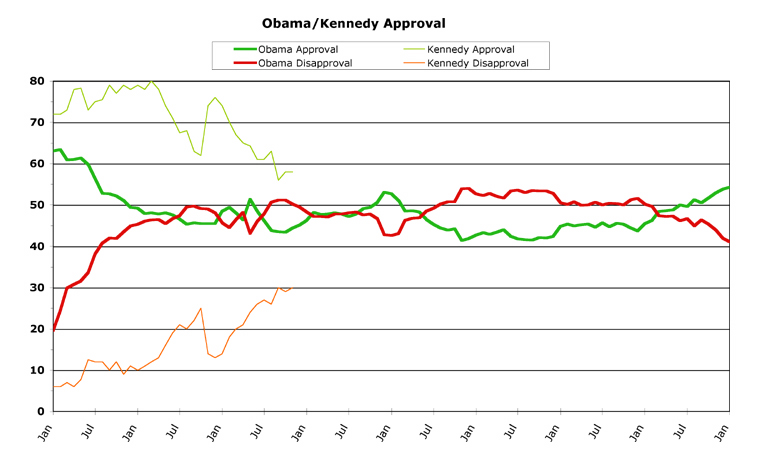
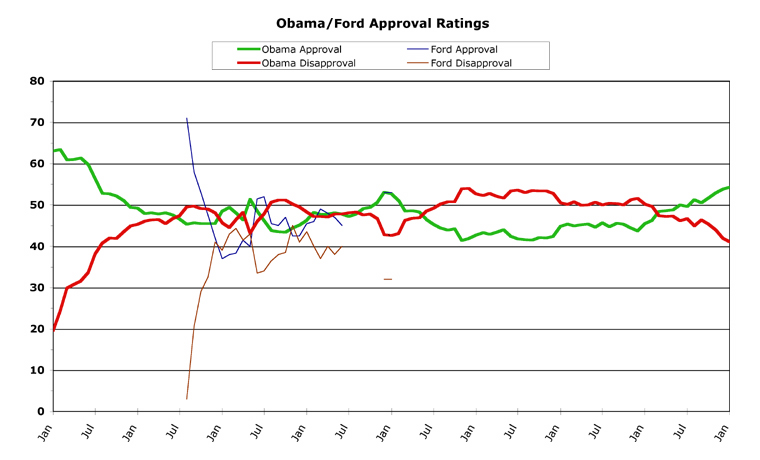
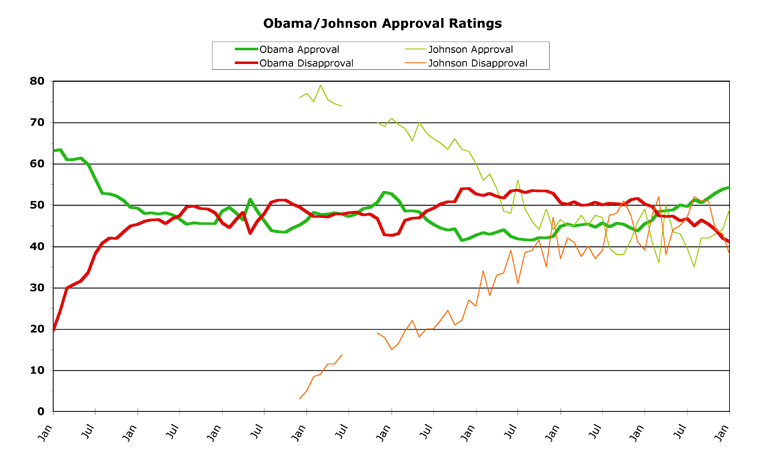
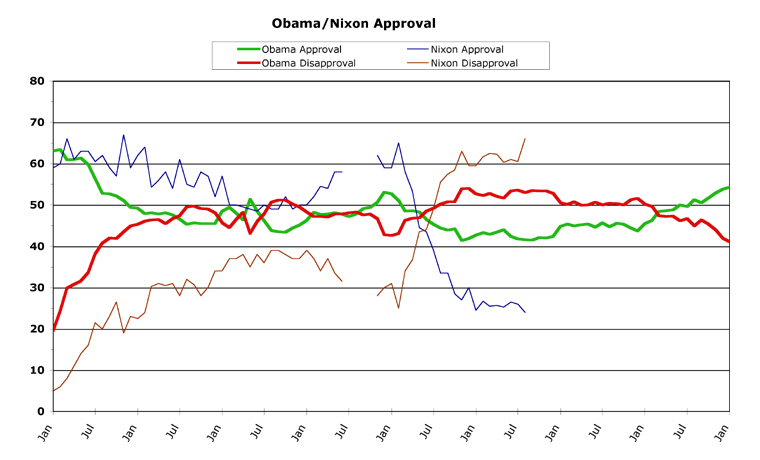
Which means we end where we began this week, plugging the Obama Poll Watch site! I included this graph to show the new format to compare presidencies, past and current. Two terms are shown on one timeline in one chart, for much easier viewing than our previous convoluted format. Former Republicans are in blue and brown, former Democrats in light green and orange, while Obama stays with green and red. Every president is fit into the same two-year span, whether they served a full two terms (G.W. Bush, Clinton, Reagan, Eisenhower), only one term (Carter, G.H.W. Bush), portions of one term (Kennedy, Ford), or portions of two terms (Johnson, Nixon). I still have a lot more to do to update the site to reflect Obama serving two terms, but for now, click on over and check out the comparison charts.
[Obama Poll Watch Data:]
Housecleaning Note
This will be the final month (no, really, we mean it this time!) we will be providing full data lists here, as it makes more sense to divide them into first- and second-term data. So, for this month only, we've got both first- and second-term data listed below (but separated). Next month, and going forward, we will provide all of the second-term data, with a link to a static list of all the data from Obama's first term. This will clean up the end of these columns a bit, as well as still providing all the monthly data for those interested.
We will still be providing, for context, the "all-time highs and lows" from both Obama's first and second terms, but separately. The lists of raw data and the archive of this column series will only have second-term data, with a link to the first-term data page.
Sources And Methodology
ObamaPollWatch.com is an admittedly amateur effort, but we do try to stay professional when it comes to revealing our sources and methodology. All our source data comes from RealClearPolitics.com; specifically from their daily presidential approval ratings "poll of polls" graphic page. We take their daily numbers, log them, and then average each month's data into a single number -- which is then shown on our monthly charts here (a "poll of polls of polls," if you will...). You can read a much-more detailed explanation of our source data and methodology on our "About Obama Poll Watch" page, if you're interested.
Questions or comments? Use the Email Chris page to drop me a private note.
Obama's First-Term Statistical Records
Monthly
Highest Monthly Approval -- 2/09 -- 63.4%
Lowest Monthly Approval -- 10/11 -- 43.4%
Highest Monthly Disapproval -- 9/11, 10/11 -- 51.2%
Lowest Monthly Disapproval -- 1/09 -- 19.6%
Daily
Highest Daily Approval -- 2/15/09 -- 65.5%
Lowest Daily Approval -- 10/9/11 -- 42.0%
Highest Daily Disapproval -- 8/30/11 -- 53.2%
Lowest Daily Disapproval -- 1/29/09 -- 19.3%
Obama's Second-Term Statistical Records
Monthly
Highest Monthly Approval -- 1/13 -- 52.7%
Lowest Monthly Approval -- 3/13 -- 48.5%
Highest Monthly Disapproval -- 3/13 -- 46.3%
Lowest Monthly Disapproval -- 1/13 -- 42.6%
Daily
Highest Daily Approval -- 1/31/13 -- 52.5%
Lowest Daily Approval -- 3/30/13 -- 47.6%
Highest Daily Disapproval -- 3/(20, 21, 24, 25)/13 -- 47.4%
Lowest Daily Disapproval -- 2/24/13 -- 42.3%
Obama's Second-Term Raw Monthly Data
[All-time high in bold, all-time low underlined.]
Month -- (Approval / Disapproval / Undecided)
03/13 -- 48.5 / 46.3 / 5.2
02/13 -- 51.1 / 43.0 / 5.9
01/13 -- 52.7 / 42.6 / 4.7
Obama's First-Term Raw Monthly Data
[All-time high in bold, all-time low underlined.]
Month -- (Approval / Disapproval / Undecided)
01/13 -- 52.7 / 42.6 / 4.7
12/12 -- 53.1 / 42.8 / 4.1
11/12 -- 50.6 / 46.7 / 2.7
10/12 -- 49.4 / 47.8 / 2.8
09/12 -- 49.1 / 47.6 / 3.3
08/12 -- 47.8 / 48.3 / 3.9
07/12 -- 47.2 / 48.1 / 4.7
06/12 -- 47.8 / 47.8 / 4.4
05/12 -- 48.1 / 47.8 / 4.1
04/12 -- 47.8 / 47.1 / 5.1
03/12 -- 47.7 / 47.2 / 5.1
02/12 -- 48.2 / 47.2 / 4.6
01/12 -- 46.3 / 48.3 / 5.4
12/11 -- 45.1 / 49.5 / 5.4
11/11 -- 44.4 / 50.2 / 5.4
10/11 -- 43.4 / 51.2 / 5.4
09/11 -- 43.5 / 51.2 / 5.3
08/11 -- 43.8 / 50.7 / 5.5
07/11 -- 46.2 / 47.8 / 6.0
06/11 -- 48.5 / 46.0 / 5.5
05/11 -- 51.4 / 43.1 / 5.5
04/11 -- 46.4 / 48.2 / 5.4
03/11 -- 48.1 / 46.4 / 5.5
02/11 -- 49.4 / 44.5 / 6.1
01/11 -- 48.5 / 45.7 / 5.8
12/10 -- 45.5 / 48.1 / 6.4
11/10 -- 45.5 / 49.0 / 5.5
10/10 -- 45.5 / 49.1 / 5.4
09/10 -- 45.7 / 49.7 / 4.6
08/10 -- 45.3 / 49.5 / 5.2
07/10 -- 46.6 / 47.4 / 6.0
06/10 -- 47.6 / 46.7 / 5.7
05/10 -- 48.1 / 45.5 / 6.4
04/10 -- 47.8 / 46.5 / 5.7
03/10 -- 48.1 / 46.4 / 5.5
02/10 -- 47.9 / 46.1 / 6.0
01/10 -- 49.2 / 45.3 / 5.5
12/09 -- 49.4 / 44.9 / 5.7
11/09 -- 51.1 / 43.5 / 5.4
10/09 -- 52.2 / 41.9 / 5.9
09/09 -- 52.7 / 42.0 / 5.3
08/09 -- 52.8 / 40.8 / 6.4
07/09 -- 56.4 / 38.1 / 5.5
06/09 -- 59.8 / 33.6 / 6.6
05/09 -- 61.4 / 31.6 / 7.0
04/09 -- 61.0 / 30.8 / 8.2
03/09 -- 60.9 / 29.9 / 9.2
02/09 -- 63.4 / 24.4 / 12.2
01/09 -- 63.1 / 19.6 / 17.3
Column Archives (Second Term)
Column Archives (First Term)
[Jan 13], [Dec 12], [Nov 12], [Oct 12], [Sep 12], [Aug 12], [Jul 12], [Jun 12], [May 12], [Apr 12], [Mar 12], [Feb 12], [Jan 12], [Dec 11], [Nov 11], [Oct 11], [Sep 11], [Aug 11], [Jul 11], [Jun 11], [May 11], [Apr 11], [Mar 11], [Feb 11], [Jan 11], [Dec 10], [Nov 10], [Oct 10], [Sep 10], [Aug 10], [Jul 10], [Jun 10], [May 10], [Apr 10], [Mar 10], [Feb 10], [Jan 10], [Dec 09], [Nov 09], [Oct 09], [Sep 09], [Aug 09], [Jul 09], [Jun 09], [May 09], [Apr 09], [Mar 09]
Chris Weigant blogs at:
Follow Chris on Twitter: @ChrisWeigant
Become a fan of Chris on Huffington Post
Full archives of OPW columns: ObamaPollWatch.com