
Obama has a good month
President Obama just had -- relatively -- the best month in job approval polling he's had for his entire second term. The reason for the qualifier in that previous sentence is that in absolute terms, Obama's poll numbers are still pretty bad, but when measured by month-to-month change, January was the best month Obama's had since the afterglow of his re-election. But then a picture is clearer than all these words, so let's take a look at the chart:
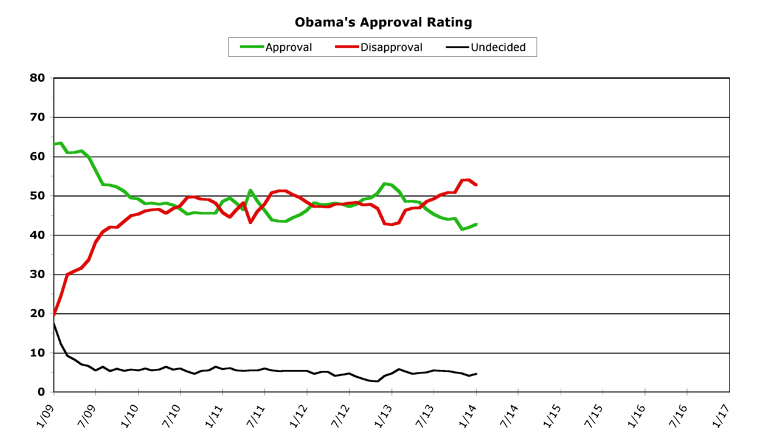
[Click on graph to see larger-scale version.]
January, 2014
As I accurately predicted last month, Obama was set to have a pretty good January -- and he did. He's also set to have a pretty good February, too, but I'm getting ahead of myself.
In January, for the first time since he's been sworn in for his second term, President Obama saw both his monthly average job approval rise and his monthly average disapproval fall. His job approval number rose to 42.7 percent, up a significant 0.8 points from December. This is the second month in a row his approval rate has risen, from his all-time low of 41.4 in November (in the depths of the Obamacare website disaster). Obama's disapproval fell for the first time since last January, to 52.7 percent -- down a full 1.3 points from the previous month.
To be fair, in absolute terms, this still is pretty dismal territory for Obama's polling. If you don't count the previous two months, Obama's January numbers would be the worst of his entire presidency -- lower than where they were at before the Obamacare website problems (44.2 approval / 50.8 disapproval), and lower than his worst numbers in his first term (43.4 / 51.2 in October of 2011). So there is no denying that Obama's still got a long way to go to get back to the popularity he once enjoyed.
But at least now he's moving in the right direction. January started with a drop in the unemployment rate, and saw other good economic news all month long. The Obamacare signup numbers keep getting better and better, and the steam seems to have gone out of the Republican demonization efforts (at least, for now). A budget agreement was reached mid-month, and it was notable for the low level of histrionics which accompanied it in Congress. The big political scandal was about a Republican, for a change (Chris Christie). Then Obama ended the month with an adequate and workable State Of The Union address. All around, a pretty good month.
Overall Trends
The overall trendlines for Obama are pretty positive right now. For the first month since he started his second term, Obama did not hit a single "all-time" record -- no daily or monthly all-time highs or lows. While his numbers held remarkably steady for the first half of January, they moved more positively later in the month, which sets up February to also be a good month for Obama's polling.
In his daily job approval average in December and January, Obama stayed in the 42-percent range for 42 days out of a 43-day stretch (he fell to 41.9 for one day during the period, but all other approval numbers were between 42.0 and 42.8). This meant he held onto the gains he made in early December, and in the last week or so of January, Obama's daily average approval has climbed to over 43.0 percent. His daily average disapproval hit a high point early in January (53.8 percent) and then fell all month long, to hit a low of 51.5 percent on the last two days of the month. Which, as I said, sets Obama up in February already ahead of his January monthly average.
The most dramatic change in metric happened in Obama's overwater/underwater rating. This is the measure of the difference between approval and disapproval. After his initial "honeymoon" period wore off, Obama has always struggled to keep his job approval number above his disapproval level. The gap widened enormously during the Obamacare website crisis, where Obama was a whopping 12.5 percent underwater in November (41.9 to 53.9) -- the worst of his entire presidency. Obama improved this to only a 12.1 percent gap in December, but in January it fell all the way to 10.0 percent. In February, this will likely fall back into single digits, at the least.
February is looking fairly good for Obama, at this point. He may receive a slight bump from the State Of The Union, but this is likely to be negligible. But he still may well complete the journey of regaining all the ground he lost in the Obamacare website disaster period. If the economic news continues to be good (unemployment numbers come out this Friday), this will also help Obama. As for Republican opposition, we're going to have another showdown on the debt ceiling this month, but so far Republicans seem awfully disorganized (they can't agree on which hostage to attempt to take, which is probably a good sign) and Obama seems pretty firm on his "send me a clean bill" stance. Republicans are also teeing up a gigantic intraparty battle over immigration, which could get quite ugly indeed, and will do nothing to hurt the president (since it'll likely be a solely Republican-on-Republican cage match). So I would predict Obama's positive trendlines will continue in February and match what he just posted in January.
OK, that's it for the monthly wrap-up. But I did want to take a little time here at the end to make a wild prediction, just for fun. For approximately the past two years, I've been pointing out the similarity between Obama's poll numbers and George W. Bush's. Both men got re-elected during this period, but both had a hard time of it, too. You can see what I mean in this zoomed-in comparison chart (the vertical line is when the election happened):
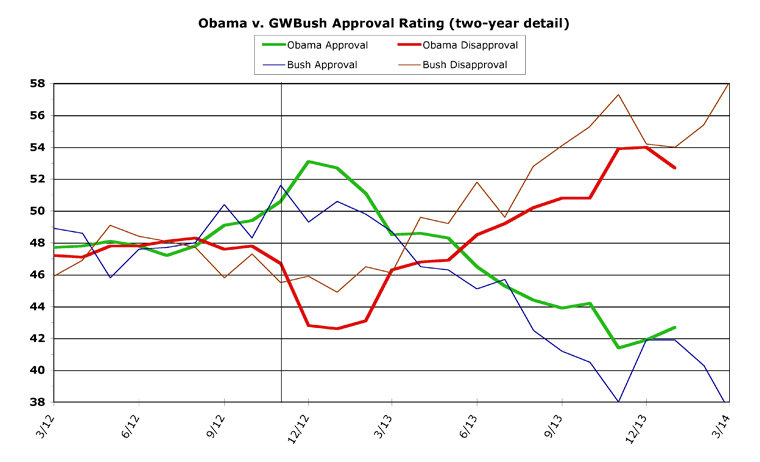
In December of their fifth years in office, Bush and Obama were only 0.2 percent apart in the polls (Obama 41.9 / 54.0, Bush 41.9 / 54.2). That is amazingly close. But this month, Obama began pulling away from Bush, and it's my guess that this is only going to continue. I think Obama's hit bottom (for the moment) while Bush was about to experience free-fall. This can be seen a lot clearer when you examine the entire picture:
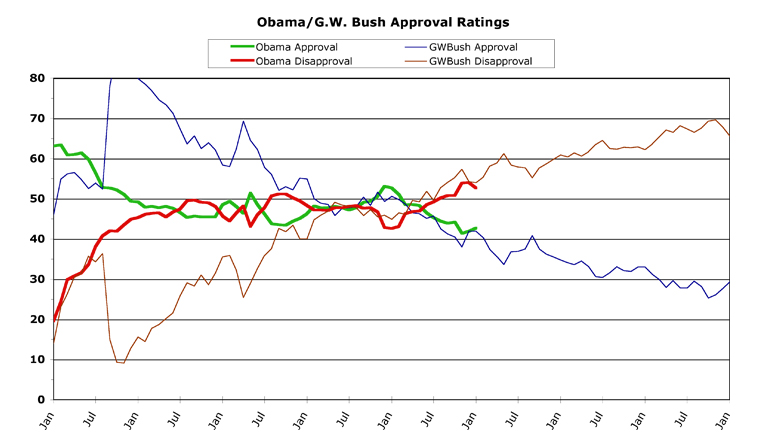
Bush was enjoying a momentary blip upwards on a severely downward slope. Bush would only enjoy one more last gasp above 40 percent for the rest of his term. Obama, by comparison, seems poised to move upwards again (or, at the very least, stay above 40 percent). Meaning that this is the last month the two men's numbers may be anywhere near each other.
Which raises the question, of course: Which other president will Obama come closest to for the remainder of his term?
Well, that's a tough one because there just aren't all that many comparisons to make. Modern opinion polling goes back to F.D.R.'s time in office, but the data gets less and less complete the further you go back. And there have only been five post-F.D.R. presidents who have served a full two terms in office, one of which (Truman) doesn't even have solid-enough monthly data for a fair comparison.
But only one of these shows anything like what Obama's been managing for his presidency. Obama is quite likely going to have his final three years in office with a lot less public support than Eisenhower and Clinton, both of which regularly topped 60 percent approval (and even 70 percent, at times) in their second terms. And Obama is, as mentioned, likely going to be a lot better than Bush and (to add in a partial-second-term president) Nixon, both of whom sank below 30 percent approval in their second terms.
This leaves only one man. Here is the comparison chart for Obama and Ronald Reagan:
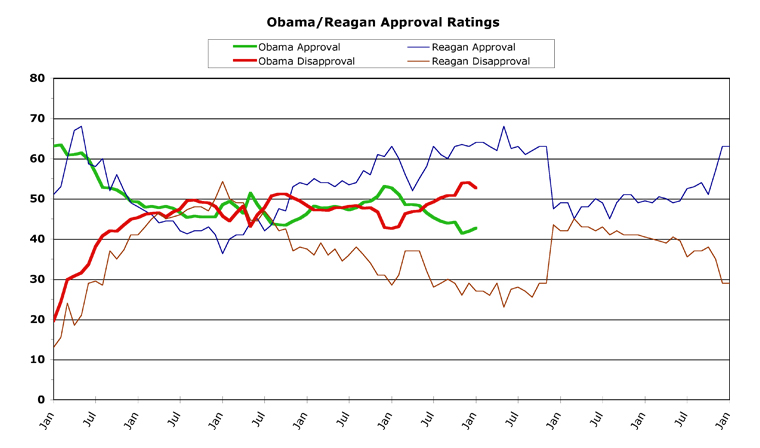
Now, to buy into this theory -- which I fully admit is going way out on a limb -- you have to believe that Obama has essentially already weathered the worst of his "second-term curse" scandals. Ronald Reagan's gigantic drop in approval came when he was forced to admit that he lied about that whole Iran/Contra thing, after all. This did enormous damage to his public reputation, and it hurt him throughout his final two years in office. Barack Obama survived a lot of smaller scandals throughout 2013. This doesn't mean they'll be the last scandals to hit the Obama administration, as any others which pop up may do his approval severe damage in the future, of course.
But if they don't -- if Obama remains relatively scandal-free from now on -- it's pretty easy to see that the final two years of his term could indeed come very close to Ronald Reagan's numbers. While all presidents get a boost at the very end of their terms (that spike up at the right-hand edge of the chart), Reagan spent a long time in the high-40s in his final years in office.
Which is right where Obama has spent a lot of time, you'll notice. If Obama continues to poll around the same range, his last two years in office could match up a lot closer to the Gipper's than any other modern president.
We'll all just have to wait and see, won't we? But if it comes to pass, remember you heard it here first.
[Obama Poll Watch Data:]
Sources And Methodology
ObamaPollWatch.com is an admittedly amateur effort, but we do try to stay professional when it comes to revealing our sources and methodology. All our source data comes from RealClearPolitics.com; specifically from their daily presidential approval ratings "poll of polls" graphic page. We take their daily numbers, log them, and then average each month's data into a single number -- which is then shown on our monthly charts here (a "poll of polls of polls," if you will...). You can read a much-more detailed explanation of our source data and methodology on our "About Obama Poll Watch" page, if you're interested.
Questions or comments? Use the Email Chris page to drop me a private note.
Obama's Second Term Statistical Records
Monthly
Highest Monthly Approval -- 1/13 -- 52.7%
Lowest Monthly Approval -- 11/13 -- 41.4%
Highest Monthly Disapproval -- 12/13 -- 54.0%
Lowest Monthly Disapproval -- 1/13 -- 42.6%
Daily
Highest Daily Approval -- 1/31/13 -- 52.5%
Lowest Daily Approval -- 12/2/13 -- 39.8%
Highest Daily Disapproval -- 12/2/13 -- 55.9%
Lowest Daily Disapproval -- 2/24/13 -- 42.3%
Obama's Second Term Raw Monthly Data
[All-time high in bold, all-time low underlined.]
Month -- (Approval / Disapproval / Undecided)
01/14 -- 42.7 / 52.7 / 4.6
12/13 -- 41.9 / 54.0 / 4.1
11/13 -- 41.4 / 53.9 / 4.7
10/13 -- 44.2 / 50.8 / 5.0
09/13 -- 43.9 / 50.8 / 5.3
08/13 -- 44.4 / 50.2 / 5.4
07/13 -- 45.3 / 49.2 / 5.5
06/13 -- 46.5 / 48.5 / 5.0
05/13 -- 48.3 / 46.9 / 4.8
04/13 -- 48.6 / 46.8 / 4.6
03/13 -- 48.5 / 46.3 / 5.2
02/13 -- 51.1 / 43.0 / 5.9
01/13 -- 52.7 / 42.6 / 4.7
Second Term Column Archives
[Dec 13], [Nov 13], [Oct 13], Sep 13], [Aug 13], [Jul 13], [Jun 13], [May 13], [Apr 13], [Mar 13], [Feb 13], [Jan 13]
First Term Data
To save space, the only data and statistics listed above are from Obama's second term. If you'd like to see the data and stats from Obama's first term, including a list of links to the full archives of the Obama Poll Watch column for the first term, we've set up an Obama Poll Watch First Term Data page, for those still interested.
Chris Weigant blogs at:
Follow Chris on Twitter: @ChrisWeigant
Become a fan of Chris on Huffington Post
Full archives of OPW columns: ObamaPollWatch.com