

Maintaining His Gains
President Obama ended up his first term by consolidating the job approval polling gains he made in his re-election. His numbers have settled into a new range, and were remarkably steady all month long. Obama's "second honeymoon" period with the public may not last more than a few months, but for now seems to be holding steady. With the election fading into the past, Obama's in a pretty good position right now in terms of "political capital," but this will likely change as legislative reality sets in.
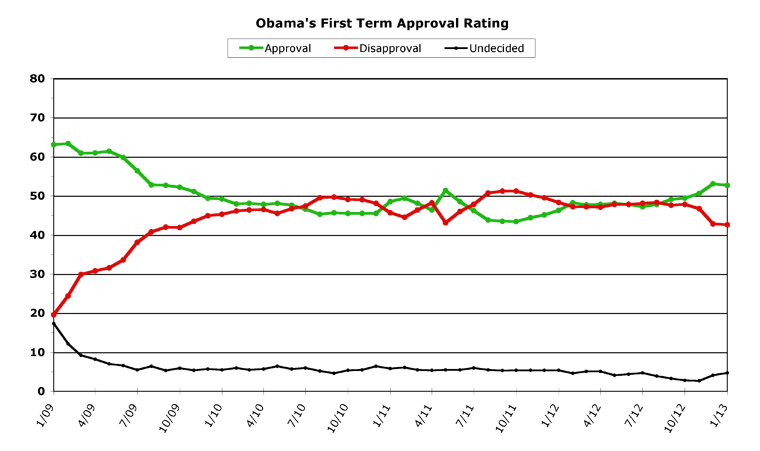
Let's go to the chart, to see how Obama finished up his first term in office:
[Click on graph to see larger-scale version.]
January, 2013
January marked the end of President Obama's first term, and the start of his second. January started off with the endgame of the fiscal cliff negotiations, where Obama scored a clean victory over the Republicans in Congress, by getting income tax rates hiked on upper-income taxpayers for the first time in 20 years. Obama scored his second political victory when the Republicans backed down on holding the world's economy hostage over the debt ceiling issue. They punted the whole decision a few months down the road, but it will likely get solved in the midst of the other upcoming budget battles.
Later in the month, Obama got the benefit of the pomp and circumstance of Inauguration Day, where he used the opportunity to give a much feistier speech than anyone expected. This sets the stage for next week's State Of The Union address to a joint session of Congress (and the American people).
Throughout all of this, Obama's job approval poll numbers stayed pretty rock steady. One outlier poll mid-month brought his average numbers down a tad, but every other poll put him between about 51 percent and 55 percent approval. The one "odd poll out" from Fox put him at only 47 percent, but this wasn't reflected in any other polling.
This resulted in a slight drop in approval, down from 53.1 to 52.7 percent. This ends Obama's longest run yet of increasing approval ratings, as it is the first such drop in the past six months. Offsetting this, Obama's disapproval numbers also dropped slightly, down 0.2 percent to a 42.6 percent average for the month. Partly, this is a result of a lot more "undecided" Americans, as the election hoopla fades. From a low of 2.7 percent the month of the election, the undecided rate was back up to a much-more-normal 4.7 percent for January.
Obama maintained his gains in one important measurement. His approval rating is "above water" (or higher than his disapproval rating) to the tune of 10.1 percent. This, with last month's 10.3 percent rating, is the best "spread" Obama has managed since the end of 2009, and is perhaps the best measurement of how much "political capital" Obama truly has right now. Even after the death of Osama Bin Laden, Obama only managed 8.3 percent, by comparison.
Overall Trends
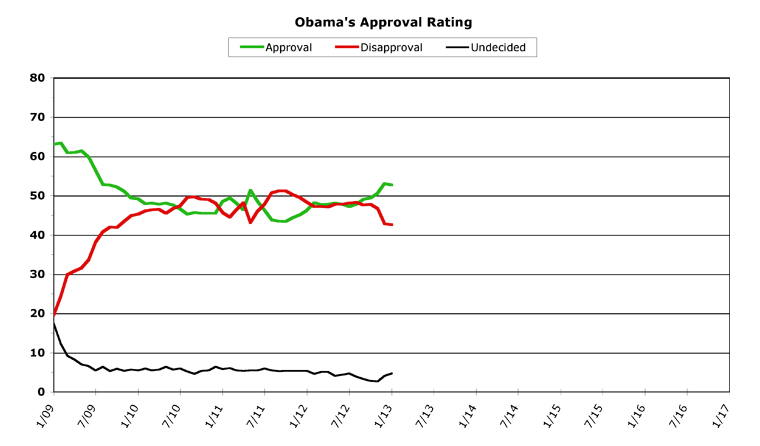
Before we get to taking a closer look at the trends, we've got a bonus chart today. This is (so far) what we've come up with to extend this chart into Obama's second term. It's really not all that different from the one we've been using for Obama's first term, really.
[Click on graph to see larger-scale version.]
We had the option of starting a whole new chart for Obama's second term, and just retiring the first term chart altogether. But this would miss putting Obama's second term numbers into some needed context, so we decided to just extend the X-axis scale to show both terms in one chart. Doing so made the data points look a little strange, so we've removed the "dots" for each month. Unless people have serious objections or brilliant suggestions in the comments today, this is probably what we're going with next month. We'll also likely be "cleaning up" the stats section at the bottom of the column, which is growing alarmingly large.
But let's get on with examining January and predicting the near future, shall we? Obama's trends for January are pretty flat. He didn't improve, he didn't lose much ground. But he did indeed hold onto where he was, which is impressive enough. Obama's five-month streak of increasing approval numbers raised his rating 5.9 percent since last July, and pushed him over 50 percent for the first time since his initial honeymoon period. If he continues polling steadily in the 51-55 percent range, Obama will gain back the 0.4 percent he lost this month (due again, largely, to one outlying poll).
This might signal a return to the pre-election steadiness Obama managed throughout much of his first term. Good news or bad, Obama's poll numbers resisted much "spiking" one way or another and instead mostly followed gentle and steady curves, or spent long periods absolutely flat. Obama got significantly good news in January, from the fiscal cliff victory to the debt ceiling victory to a wonderful inauguration. He's been using the "bully pulpit" with a vengeance, pushing his agenda on gun control, comprehensive immigration reform, and budget issues, but none of this has moved his numbers above the bounce he got from the election. February will have one good moment in the spotlight, as Obama lays out his second term agenda in the State Of The Union speech, but the end of the month is likely to be consumed with congressional squabbling over the budget once again.
If Obama scores an early legislative victory (such as a gun control bill passing the Senate, perhaps), this could give him a small boost. Traditionally, however, honeymoons with the public usually end within a few months (especially in second terms). So the trend heading into the Spring will likely be one of slowly receding job approval. For the moment, if Obama keeps posting numbers with the same steadiness he showed in January, the trendline is one of maintaining his election gains. But once disappointing compromises become necessary to move legislation, Obama's approval ratings are likely to fade. The question will then become how much of a drop he'll experience before he can level them off again. For now, though, he's in better shape than he has been for the past three years.
[Obama Poll Watch Data:]
Sources And Methodology
ObamaPollWatch.com is an admittedly amateur effort, but we do try to stay professional when it comes to revealing our sources and methodology. All our source data comes from RealClearPolitics.com; specifically from their daily presidential approval ratings "poll of polls" graphic page. We take their daily numbers, log them, and then average each month's data into a single number -- which is then shown on our monthly charts here (a "poll of polls of polls," if you will...). You can read a much-more detailed explanation of our source data and methodology on our "About Obama Poll Watch" page, if you're interested.
Questions or comments? Use the Email Chris page to drop me a private note.
Column Archives
[Dec 12], [Nov 12], [Oct 12], [Sep 12], [Aug 12], [Jul 12], [Jun 12], [May 12], [Apr 12], [Mar 12], [Feb 12], [Jan 12], [Dec 11], [Nov 11], [Oct 11], [Sep 11], [Aug 11], [Jul 11], [Jun 11], [May 11], [Apr 11], [Mar 11], [Feb 11], [Jan 11], [Dec 10], [Nov 10], [Oct 10], [Sep 10], [Aug 10], [Jul 10], [Jun 10], [May 10], [Apr 10], [Mar 10], [Feb 10], [Jan 10], [Dec 09], [Nov 09], [Oct 09], [Sep 09], [Aug 09], [Jul 09], [Jun 09], [May 09], [Apr 09], [Mar 09]
Obama's All-Time Statistics
Monthly
Highest Monthly Approval -- 2/09 -- 63.4%
Lowest Monthly Approval -- 10/11 -- 43.4%
Highest Monthly Disapproval -- 9/11, 10/11 -- 51.2%
Lowest Monthly Disapproval -- 1/09 -- 19.6%
Daily
Highest Daily Approval -- 2/15/09 -- 65.5%
Lowest Daily Approval -- 10/9/11 -- 42.0%
Highest Daily Disapproval -- 8/30/11 -- 53.2%
Lowest Daily Disapproval -- 1/29/09 -- 19.3%
Obama's Raw Monthly Data
[All-time high in bold, all-time low underlined.]
Month -- (Approval / Disapproval / Undecided)
01/13 -- 52.7 / 42.6 / 4.7
12/12 -- 53.1 / 42.8 / 4.1
11/12 -- 50.6 / 46.7 / 2.7
10/12 -- 49.4 / 47.8 / 2.8
09/12 -- 49.1 / 47.6 / 3.3
08/12 -- 47.8 / 48.3 / 3.9
07/12 -- 47.2 / 48.1 / 4.7
06/12 -- 47.8 / 47.8 / 4.4
05/12 -- 48.1 / 47.8 / 4.1
04/12 -- 47.8 / 47.1 / 5.1
03/12 -- 47.7 / 47.2 / 5.1
02/12 -- 48.2 / 47.2 / 4.6
01/12 -- 46.3 / 48.3 / 5.4
12/11 -- 45.1 / 49.5 / 5.4
11/11 -- 44.4 / 50.2 / 5.4
10/11 -- 43.4 / 51.2 / 5.4
09/11 -- 43.5 / 51.2 / 5.3
08/11 -- 43.8 / 50.7 / 5.5
07/11 -- 46.2 / 47.8 / 6.0
06/11 -- 48.5 / 46.0 / 5.5
05/11 -- 51.4 / 43.1 / 5.5
04/11 -- 46.4 / 48.2 / 5.4
03/11 -- 48.1 / 46.4 / 5.5
02/11 -- 49.4 / 44.5 / 6.1
01/11 -- 48.5 / 45.7 / 5.8
12/10 -- 45.5 / 48.1 / 6.4
11/10 -- 45.5 / 49.0 / 5.5
10/10 -- 45.5 / 49.1 / 5.4
09/10 -- 45.7 / 49.7 / 4.6
08/10 -- 45.3 / 49.5 / 5.2
07/10 -- 46.6 / 47.4 / 6.0
06/10 -- 47.6 / 46.7 / 5.7
05/10 -- 48.1 / 45.5 / 6.4
04/10 -- 47.8 / 46.5 / 5.7
03/10 -- 48.1 / 46.4 / 5.5
02/10 -- 47.9 / 46.1 / 6.0
01/10 -- 49.2 / 45.3 / 5.5
12/09 -- 49.4 / 44.9 / 5.7
11/09 -- 51.1 / 43.5 / 5.4
10/09 -- 52.2 / 41.9 / 5.9
09/09 -- 52.7 / 42.0 / 5.3
08/09 -- 52.8 / 40.8 / 6.4
07/09 -- 56.4 / 38.1 / 5.5
06/09 -- 59.8 / 33.6 / 6.6
05/09 -- 61.4 / 31.6 / 7.0
04/09 -- 61.0 / 30.8 / 8.2
03/09 -- 60.9 / 29.9 / 9.2
02/09 -- 63.4 / 24.4 / 12.2
01/09 -- 63.1 / 19.6 / 17.3
Chris Weigant blogs at:
Follow Chris on Twitter: @ChrisWeigant
Become a fan of Chris on Huffington Post
Full archives of OPW columns: ObamaPollWatch.com