
Finally, some good news
While I would immediately caution everyone not to get overly optimistic about what I'm about to say, President Obama's approval rating was looking up in April. Gains were modest, but were pretty much across the board. Although, as I said, the end of the month saw a slight reversal to this trend, likely the result of the drip, drip, drip nature (or, more properly, "gush, gush, gush") of the BP oil spill in the Gulf of Mexico.
More on all of that in a bit. As well as a special look, at the end here, at how Obama stacks up against Ronald Reagan's first term. We're interrupting our march backwards through time, comparing Obama to all previous presidents for whom polling data is available, to highlight the Obama versus Reagan picture. Of course, graphs comparing Obama with every previous president back to Eisenhower are always available at the Obama Poll Watch website, for your perusal.
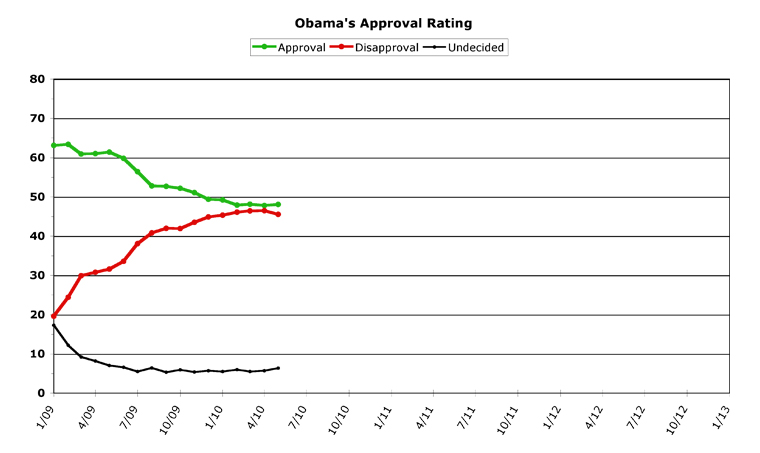
But first, let's look at the updated graph:
[Click on graph to see larger-scale version.]
May, 2010
As you can see, Obama's approval rate went up slightly in May, and his disapproval rate went more sharply downward. While both of these are what pollsters would call "within the margin of error" it is still notable since Barack Obama actually charted the best month of his entire term in office on this graph. It may not look like it all that much, but this was the first month where Obama's approval rate improved and his disapproval rate declined within the same month. And it's the biggest decline in disapproval he's ever charted.
About the biggest political news in May was the increase in raw fear among incumbents of both parties in Washington, especially those who have recently changed party affiliation. There's a strong "throw the bums out" feeling across the nation, or so the media tells us, which has resulted in the Democratic Party scorning so-called "moderates" in favor of honest, red-blooded Democratic candidates. Over on the Republican side, the Tea Party folks are purging the Republicans with all their might, whether it will help them elect people in November or not. Admittedly, that's a somewhat biased view, but the fact remains that both parties are purifying themselves a bit in select races across the country. How it all plays out in the midterms is still an open question, however, I should honestly state.
At the beginning of the month, Obama got some really good news on the jobs and unemployment situation, which is the Democrats' best hope for turning public opinion around by the fall. If we get a few more months like last month in an unbroken chain, and if the actual unemployment rate starts coming down in a noticeable way, then the midterms might not be the slaughter Republicans have been predicting.
Arizona has pushed immigration to the top of the political "to do" list, but that's no guarantee that anything will actually get done on it, other than politicians using it heavily in their campaign advertising.
Wall Street reform is wending its way through Congress, and we may actually get a final bill approved before Fourth of July. Then again, we may not. But Democrats are making good progress on the issue, and Republicans are taking the side of Wall Street. Look for this to figure prominently in campaign advertising as well. Also on the Senate's schedule in June will be possibly abolishing the "Don't Ask, Don't Tell" policy of forbidding openly gay people from serving in the military, which would go a long way towards raising some enthusiasm in the Democratic base for both Obama and congressional Democrats.
Obama took a minor hit on the Joe Sestak situation, but mostly for stonewalling the press on the question. Now that they've addressed it, the issue will likely die down except over on the far right. But the big hit Obama is taking, and will likely continue to take for a while, is over the BP oil spill. Republicans, who normally cry "Evil!" at any attempt by government to insert itself into the affairs of private companies, are now falling all over themselves begging President Obama to take over the BP response and cleanup effort. The irony is thick indeed, although out of empathy for the residents who live in the affected region, I shall refrain from a "How thick is it?" irony joke, as it is too cheap a shot.
In May, Obama's approval rating rose three-tenths of a point, gaining back the ground he lost last month. For the month, Obama was at 48.1 percent, back where he was in March, and above where he was in February and April. While this means that for four months his approval has been essentially unchanged (the entire movement during this period was within the same three-tenths of a percent, which is remarkably stable for any president), at least it headed in the right direction in May. Obama's disapproval rate fell a full percentage point, however, to end up at 45.5 percent. This is the biggest, steepest fall this number has ever taken, which is indeed notable. The only previous time his disapproval rate actually fell was in October of last year, when it fell by only one-tenth of a percent. This could signify that public opposition to the president may have peaked, although it is too early to tell this, from just a single month's data.
Overall Trends
More good news for Obama was that he didn't chart a single "all-time high" or "all-time low" this month. His monthly numbers improved last month, as noted, and his daily averages were also better for the entire month.
Obama's numbers started the month by continuing the trend they had been showing in the latter half of April, with approval numbers moving slightly higher and disapproval numbers moving sharply lower. His approval number peaked around mid-month at 49.0 percent, higher than last month's daily high of 48.7 percent. The last third of the month, however, his approval numbers slipped back down to lower than they were at the start the month, hitting a daily low of 47.0 percent. On the bright side, this was much higher than the 46.1 percent all-time daily low he hit last month. Obama's disapproval went down to 44.4 percent in the beginning of May, again continuing the trend from mid-April. This is notable because Obama hadn't posted a disapproval number lower than 45.0 percent since January -- his daily low last month was only 45.7 percent, for instance. But by the end of the month, this was climbing again, and hit a high of 46.4 percent for the month -- well below the all-time high of 47.8 percent in March, and a full percent below the 47.4 percent he hit in the middle of April. This marks two months in a row Obama hasn't hit an all-time daily disapproval high.
The movement throughout the month would have been a lot more impressive without the falloff which happened in about the last week of the month. Take a look at the daily chart over at RealClearPolitics to see what I'm talking about. Up until the final week in the month, Obama was averaging six-tenths of a point increase in approval (twice what he ended up with), and a whopping 1.6 percent fall in disapproval.
But that final week is the reason why I urge caution, even though Obama did have the best month numerically he's yet had as president. Because the daily trend has changed, which the monthly trend hasn't shown yet (and won't, until next month). How June will shape up for Obama is going to depend on three major areas -- what the jobs/unemployment numbers have to say about May (these numbers will be released this Friday), what happens with the oil spill (and the public perception of Obama's response), and what actually makes it through Congress, after they get back from their current week-long vacation, and before their next week-long vacation starts at the beginning of next month. The jobs picture, if it improves, will add to an undercurrent of slightly-rising expectations which should help both Obama and Democrats in general. The oil response depends on two things happening: capping the well somehow, and an overwhelming and very public cleanup effort, with thousands of people employed by BP to clean up the damage to the beaches. Congress may pass the "Don't Ask, Don't Tell" repeal this month, and they may actually finish the Wall Street reform bill and put it on Obama's desk. Then again, they may not (this is the Senate we're talking about, after all). Due to the looming election, the next few weeks in Congress may be the most productive weeks of the entire year, which could boost public opinion in a major way. Meaning that, while the current trend is downwards for Obama's numbers, he has a good chance of turning it around by month's end, and holding on to the gains he made this month. Then again, the current trend could continue, and he may lose the gains he just made. Only time will tell.
Obama v. Reagan (first term)
Our year-long effort at assembling data and charts to compare Barack Obama with his predecessors is taking a one-month hiatus. We've only got two more presidents to go, since public opinion polling simply did not exist before F.D.R.'s time. Next month, we will continue with a comparison between Obama and Truman, but for this month I'd like to take this time to update the comparison chart between Obama and Ronald Reagan's first term.
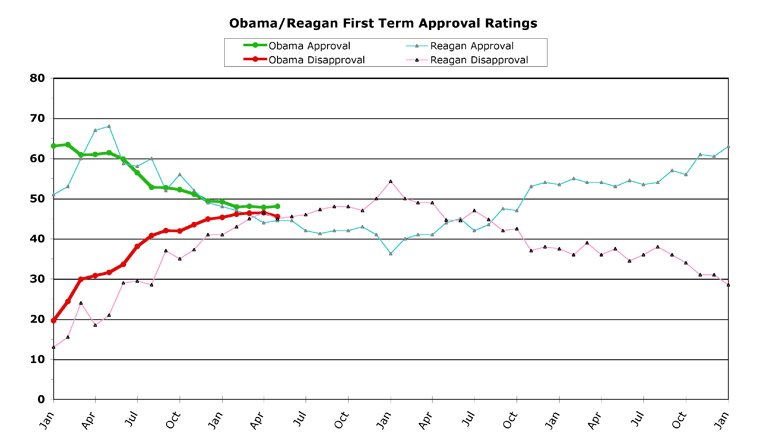
First, take a look at the chart:
[Click on graphs to see larger-scale versions.]
As always, I fully admit that predicting the future of any president by drawing parallels to past presidents is indeed a fool's game, but it's certainly a fun one to play, so if you're not into this sort of thing, I advise you to just stop reading here.
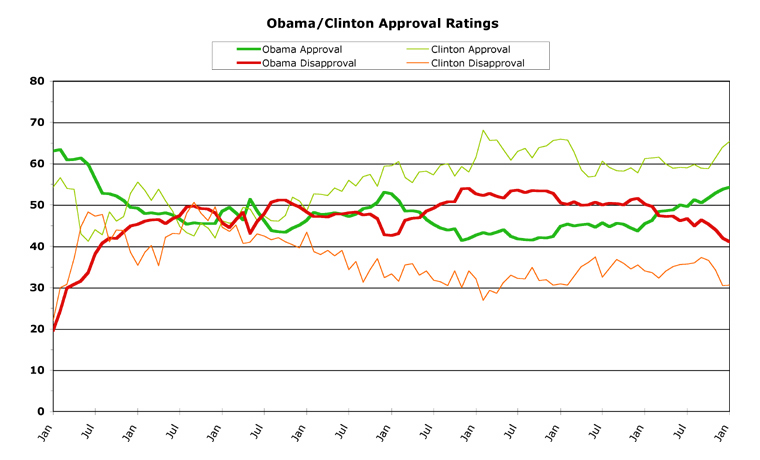
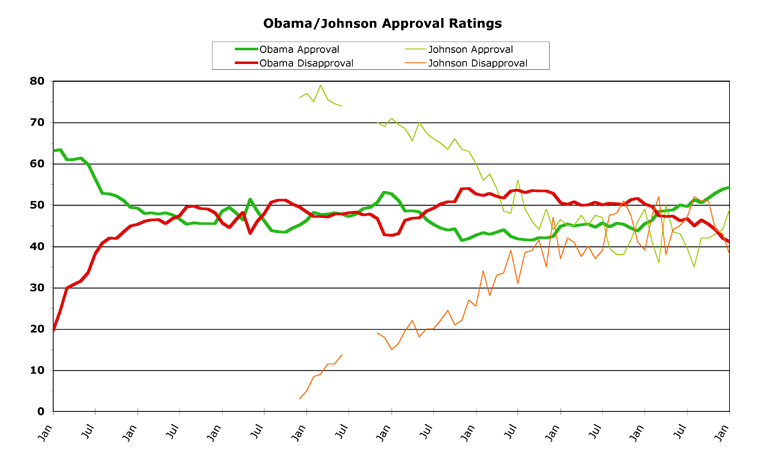
Out of all past presidents we have so far examined, from George W. Bush back through Dwight D. Eisenhower, there are really only a few parallels that can even be drawn with Obama's approval chart. Obama is roughly in the same place in the polls right now as Bill Clinton was at this point in his first term; but there the parallel ends, because they both took very different paths to get to this point. Obama's chart is much more similar to Lyndon B. Johnson's -- but the comparison is to Johnson's second term (his only full term in office), making the comparison a little less of an obvious parallel [links in this section take you to our comparison graphs].
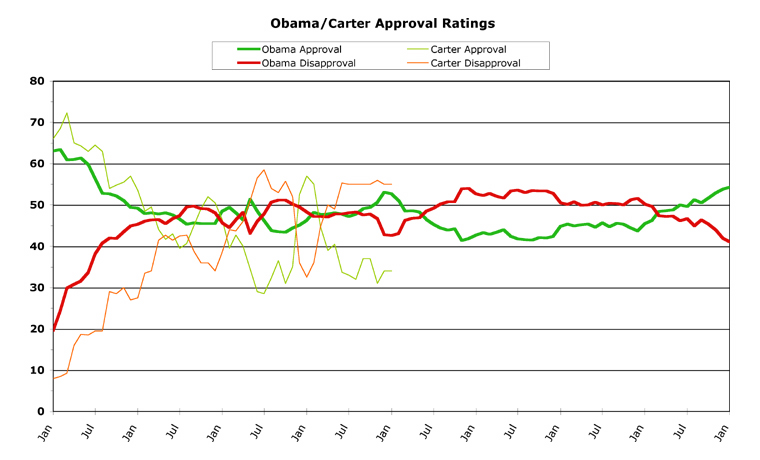
Obama's graph, though, has so far tracked the graph of Ronald Reagan's fairly closely, up until the last few months. Reagan's numbers, however, continued to slide right up to his first midterm election, after which they took an even steeper dive, before Reagan regained his popularity and went on to win his second term in a landslide.
Reagan and Obama faced similar situations coming in to office, on the economic front. Unemployment was high, a recession was in progress, and the mood of the American people was just as fickle back then as it is now. The recovery under Reagan took a long time to show positive effects, and people were disgruntled in the meantime. Reagan actually had to raise taxes during this period, even though conservatives like to conveniently forget this fact.
In both Reagan and Obama's case, the midterm election period was a disappointing time, both for the country at large and for presidential approval ratings. The main point I'm trying to make here is that predicting an entire presidency's outcome from the first year and a half of approval ratings is just as much of a fool's game as comparing presidents' charts is. The economy did improve by 1984, and Reagan's approval ratings climbed as a result. The same thing could happen to Barack Obama, who is currently doing a bit better than Ronnie was at this point.
But, just to prove what a fool's game this truly is, there is one other president whose graph closely tracks with Obama's right now: Jimmy Carter. And things didn't work out so well politically for Carter, in the end. Especially during his final year in office, which was consumed with the Iranian hostage crisis (which pundits are glomming onto right now in comparison to Obama and the BP spill, due to the long-term nature of both crises).
Will Obama's presidency wind up charting a similar course as Carter, or will he recover as Reagan did? Only a fool would even contemplate making such a prediction at this point, that's all that really can be said.
[Obama Poll Watch Data:]
Column Archives
[Apr 10], [Mar 10], [Feb 10], [Jan 10], [Dec 09], [Nov 09], [Oct 09], [Sep 09], [Aug 09], [Jul 09], [Jun 09], [May 09], [Apr 09], [Mar 09]
Obama's All-Time Statistics
Monthly
Highest Monthly Approval -- 2/09 -- 63.4%
Lowest Monthly Approval -- 4/10 -- 47.8%
Highest Monthly Disapproval -- 4/10 -- 46.5%
Lowest Monthly Disapproval -- 1/09 -- 19.6%
Daily
Highest Daily Approval -- 2/15/09 -- 65.5%
Lowest Daily Approval -- 4/11/10 -- 46.1%
Highest Daily Disapproval -- 3/18/10 -- 47.8%
Lowest Daily Disapproval -- 1/29/09 -- 19.3%
Obama's Raw Monthly Data
[All-time high in bold, all-time low underlined.]
Month -- (Approval / Disapproval / Undecided)
05/10 -- 48.1 / 45.5 / 6.4
04/10 -- 47.8 / 46.5 / 5.7
03/10 -- 48.1 / 46.4 / 5.5
02/10 -- 47.9 / 46.1 / 6.0
01/10 -- 49.2 / 45.3 / 5.5
12/09 -- 49.4 / 44.9 / 5.7
11/09 -- 51.1 / 43.5 / 5.4
10/09 -- 52.2 / 41.9 / 5.9
09/09 -- 52.7 / 42.0 / 5.3
08/09 -- 52.8 / 40.8 / 6.4
07/09 -- 56.4 / 38.1 / 5.5
06/09 -- 59.8 / 33.6 / 6.6
05/09 -- 61.4 / 31.6 / 7.0
04/09 -- 61.0 / 30.8 / 8.2
03/09 -- 60.9 / 29.9 / 9.2
02/09 -- 63.4 / 24.4 / 12.2
01/09 -- 63.1 / 19.6 / 17.3
ObamaPollWatch site:
Chris Weigant blogs at:
Follow Chris on Twitter: @ChrisWeigant