Many students and parents often ask us questions about how easy one school is versus another or where their best chance is. Most college counselors and tutors answer these questions with experience and intuition, but we believe data can add a third layer to the equation. Using the Office of Institutional Research, Common Data Set, and other supplemental data from universities, we can dig deep into the statistical data behind each university. This data can give us insights into the ways schools are thinking about admissions, average SAT/ACT scores, and other activities. In this article, we will cover ways to uncover GPA and SAT sensitivity, school selectivity, and changes in selectivity over time.
SAT sensitivity
Often at Synocate, we meet students who are what we call "splitter candidates" -- they have a higher GPA or SAT than the other counterpart. For example, many students have a higher ACT or SAT than GPA. These students are statistically at a disadvantage when applying to some schools and at an advantage when applying to others.
This chart shows the highest SAT sensitive schools, on a 1600 point scale.
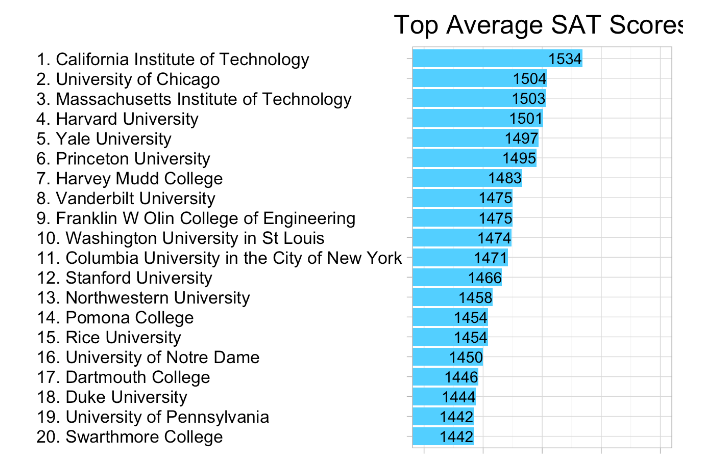
These particular schools are SAT sensitive and are particularly focused on students with high SAT scores. To most people, these schools feel the same -- reach schools. But there are nuances like affinity to SAT that can boost an applicant's chance if we know that they have a particular high SAT score, for example.
Tuition Analysis
Another important variable to consider is the tuition of a university -- the cost to attend, the average scholarship awarded, and other statistics. This graph shows a basic view of tuition across all US universities organized by ranges. We find that there are many more universities on the East Coast, although some of the most expensive schools are across the West Coast.

There are many schools with lower tuition in the middle of the United States, and this is probably due to the lower cost of living. It is probably a good place to start looking if you are tuition sensitive.
Admissions Sensitivity
Another interesting analysis we do is to rank schools by admissions rate. We find the usual Ivy League suspects but also some smaller, very selective schools like Pomona and Amherst. These schools often are correlated with higher early action and early decision acceptance rates as they are looking to attract candidates that truly want to attend their school.
This in turn results in an admissions strategy we often use with students to apply ED or EA to schools that are selective but often overlooked due to location or, more often, size.

A further analysis we do on this is the change in acceptance rate over time to determine which schools are becoming the most competitive fastest. Everyone knows the top 20 schools have become asymptotically competitive, but what does that mean for the future? Where should I apply? This is where this derivative analysis can come into effect.
Stay tuned at www.synocate.com/blog for more articles on using statstistics in the college admissions process or join a webinar.