
In my last column, I suggested that your inner statistician had a bit more to offer than just sensitivity and specificity -- but left the rest for another day. To paraphrase Sandra Bullock's perfectly delivered "It's later, Bert!" from "The Blind Side": It's another day.
On the chance you don't recall the 2X2 table from last time, here it is again -- and once again, we will find it useful:
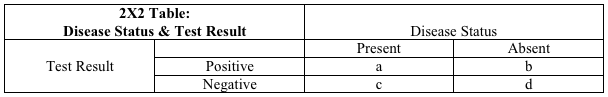
Last time, we established the definitions of sensitivity and specificity as they relate to this table. Sensitivity, the capacity of a test to detect what is truly there, is [a/(a + c)]. Specificity, the capacity of a test to exclude what is truly absent, is [d/(b + d)]. We then explored the utility of these two parameters in helping you get the right test at the right time -- for ruling in, or preferably, ruling out disease.
But a problem might have occurred to those of you who don't wince at the recollection of algebra. The denominators for both the sensitivity and specificity formulas are the columns in the table, rather than rows. For sensitivity, the denominator is the first column, for specificity, the second. The columns represent disease status: present in column 1, absent in column 2.
See the problem? Sensitivity is the capacity of a test to detect a condition when it is really there. But if we already knew whether or not the disease were really there, we wouldn't need the test! Similarly, specificity is the capacity to exclude a disease when it is truly absent. But the whole reason for doing the test is: We don't yet know if the disease is absent!
Sensitivity and specificity are properties of a test that depend on knowing something about disease status. They are important properties, as we explored last time -- but also limited. When getting a medical test, we generally don't know disease status. So what can we do about that limitation?
Fortunately, the answer is easy: shift our worldview from columns to rows.
The rows in the 2X2 table represent test results. Row 1 is everyone who tests positive (whether correctly, or incorrectly). Row 2 is everyone who tests negative (ditto).
The value in a row-based worldview is that "test status" is something we do know! You get a test, it provides a result, and then we know: You are in row 1 if the test was positive, row 2 if the test was negative.
What we really want to know -- as doctor or as patient -- is this: Given this test result, is disease present or absent? The measures that help us get there are called predictive values.
The proportion of people with a positive test result who actually have the disease is called the positive predictive value. It is, literally, how reliably a positive test result predicts the actual presence of disease. In the table, it is [a/(a + b)]. Cell "a" is everyone who both has the disease and a positive test; cell "b" is the group that gets a false positive test result despite not having the disease. The formula [a/(a + b)] is the proportion of the time a positive test result is correct.
If the positive predictive value is high, a positive test result means that a disease is almost certainly present. If low, a positive test result may well be a false positive -- which leaves you a long way from certainty.
Then, there is negative predictive value: the probability that disease is absent given a negative test result. The formula and logic are derived just as before. All those with negative test results, whether correct or incorrect, are in cells "c" and "d." Those with a correctly negative test result (i.e., truly free of disease) are in cell "d." So, the negative predictive value -- the proportion of those with a negative test result who are truly disease free -- is [d/(b + d)].
When the negative predictive value is high, a negative test reliably means disease is absent. When low, a negative test still leaves things very much in doubt.
Now, another issue may have occurred to you. The properties of positive and negative predictive value sound a bit like specificity and sensitivity, respectively. If you recall SPin and SNout from last time, you remember that high specificity helps to rule a diagnosis in -- which sounds like a high positive predictive value. A high sensitivity helps to rule a diagnosis out, which sounds like high negative predictive value. If you were thinking this, good for you -- it's entirely correct.
So how do predictive values truly differ from sensitivity and specificity? What really makes a row-based worldview differ meaningfully from a column-based worldview? In a word: you.
Predictive values vary with your personal characteristics; sensitivity and specificity are properties of a test, and do not. This is a direct result of moving from columns to rows. In the columns of the table, everyone either has the disease, or is disease-free. The rows of the table are a mix of those with and without the disease. Consequently, the proportion of people in the table (i.e., the population) with the disease will influence the predictive values. At the individual level, the probability of you having the disease in the first place -- before testing begins -- influences the reliability of the test result! I can best explain this with an example:
We'll keep things simple. The condition of concern is heart disease and the symptom is chest pain. The test is an EKG, and we'll say it has a sensitivity of 75 percent and a specificity of 70 percent. If we thought only about the test -- that is, if we adopted a "column-based" view of the world -- then an EKG positive for heart disease would always mean the same thing.
But common sense quickly reveals this must be nonsense. What if one patient with chest pain is a perfectly healthy 18-year-old pole-vaulter who just accidentally jammed her pole into her chest, and another is a 67-year-old man with an established history of angina who gets pain just like his angina while climbing stairs? If EKGs in these two patients happen to look somewhat alike, and are similarly consistent with (but not definitive for) heart disease, do we really believe a heart disease diagnosis is equally probable in both?
Of course not. The probability that chest pain is heart disease is just about nil in a healthy young athlete with a perfectly obvious alternative explanation for chest pain. Conversely, the probability that chest pain mimicking prior bouts of angina in a patient with known heart disease is due to heart disease is just about a certainty.
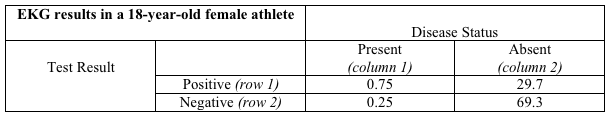
Predictive values take this into account, whereas sensitivity and specificity do not. Let's say, for argument's sake, that the young woman's probability of heart disease is 1 percent or less; and the man's is 90 percent or more. Using the same sensitivity and specificity values for the EKG in both cases, we can construct different 2X2 tables for her, and for him, imagining in both cases that the test were run in 100 similar patients:
Her table:
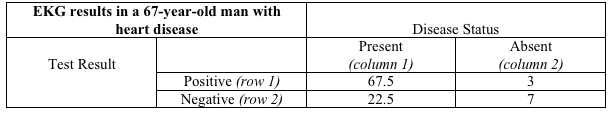
His table:
The letters in the tables have been replaced with numbers. So where do those numbers come from?
They represent the results of combining the sensitivity and specificity of the EKG with the probability of heart disease in each patient. Since the young girl has a 1 percent probability of heart disease, there would be -- at most -- one case of heart disease in a population of 100 patients just like her. That's what "her table" shows: There is one person in column 1, and 99 in column 2. A test with 75 percent sensitivity would detect 75 percent of the one case (detecting part of a person is a bit silly, I realize, but you get the idea), and that's where 0.75 comes from in cell "a." The remaining 0.25 of the true cases would be missed, and that is shown in cell "c." Of the 99 people like the young girl free of heart disease, a test with 70 percent specificity would yield a negative result in 69.3 (cell "d") and a false positive result in the remaining 29.7 (cell "b"). That's her table.
His table is filled in just the same way, using the same values for sensitivity and specificity -- but assuming that 90 people out of 100 like him do have heart disease and 10 do not.
And now, at last, we come to the important distinction between a column-based and row-based view of the world. A column-based view of the world is a test-based view; a row-based view of the world is a patient-based view. And if you are the patient, it's a you-based view -- as it ought to be.
What is the probability of heart disease in the young girl, and in the older man, assuming both have an EKG with the same abnormal appearance? The probability of disease in those with a positive test result is the positive predictive value, or [a/(a + b)]. For him, that's [67.5/(67.5 + 3)], or 95.7 percent. In other words, an abnormal EKG in this man with known heart disease and chest pain like prior angina is almost certain to mean heart pain now.
But the girl's probability of heart pain is [0.75/(0.75 + 29.7)], or less than 2.5 percent. In this young girl with almost no chance of having heart disease, she still has almost no chance of having heart disease even after her EKG comes in suggesting that she does!
And that is the next, essential contribution your inner statistician needs to make to your clinical care. The probability of a test result meaning disease is truly present, or truly absent, does not just depend on the test. It depends on the probability that you might have had the condition in question in the first place! It doesn't matter how reliable a pregnancy test is -- if it comes back positive in a male patient, it's wrong.
Of course, the example above is willfully oversimplified. An EKG is unlikely to perform exactly the same way in a young woman and an older man. But that just means that individual characteristics are even more important -- and the details of this can, once again, be a topic for another day.
Ideally, your doctor is well aware of all this (it is taught in medical school under either the rubric of biostatistics, or clinical epidemiology) and is routinely factoring such considerations into the interpretation of all medical tests. But my time in the trenches suggests otherwise.
Many doctors, particularly young doctors, come to view test results as if handed down direct from the heavens -- and forget that context greatly alters their implications. It shouldn't be your burden to defend against this -- but alas, it is. Because, as noted last time, you, the patient, are the one with skin in the game.
So along with asking if a rule-in test is specific enough to be trusted, and if a rule-out test is sensitive enough to do the job, you should also be asking this: How probable is it that I have this condition before we get started with any testing? The results of a test should not supplant this estimate -- called the prior probability of disease -- but should be combined with it to generate reliable guidance. Guidance that isn't just about some diagnostic test, but is -- as it should be -- about you!
-fin
Dr. David L. Katz; www.davidkatzmd.com
www.turnthetidefoundation.org