Poll and poll averages generally understated Republican margins at the end of campaign 2014. We examine three theories that may explain why. This is HuffPollster for Friday, November 14, 2014.
In the immediate aftermath of last week's elections, HuffPollster and other polling analysts noted that polls generally understated support for Republicans. What explains the "skew"?
As HuffPollster noted in reporting on Gallup's troubles in 2012, past investigations of polling misfires typically identified not one big culprit, but a series of smaller issues all creating a statistical bias in the same direction. While firm conclusions about this year's results are still premature, here are three theories that may explain why polls tended to understate Republicans in the days and weeks leading up to the election.
These hypotheses are not mutually exclusive. In fact, they all derive from the same basic idea: that polls may have been out of sync with an underlying Republican advantages on political fundamentals, which drove both turnout and trends in voter preferences.
First, Republican Senate candidates benefited from a modest upward trend over the course of the campaign. As HuffPollster reported before the election, polls showed all but one of the Republicans in the most competitive Senate races improving their standing against their Democratic opponents between early September and Election Day. The exception was Kansas, where independent Greg Orman saw a surge in support in September following the departure of the Democratic candidate from the race, but even there, Sen. Pat Roberts made modest gains during October.
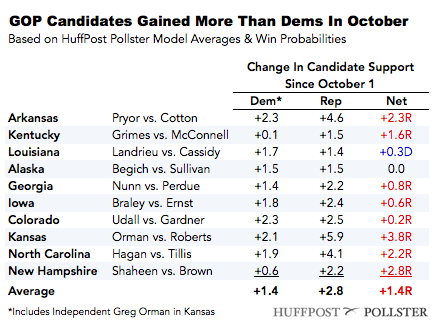
These trends followed a pattern predicted by political analyst Sean Trende and by Republican pollster Patrick Lanne. Both noted that in recent elections, particularly 2006, vote totals for incumbent senators "have tended to converge on the president’s job approval" rating, as Trende put it in September. "If a candidate is above the president’s job approval," he wrote, "the tendency is that he or she finds his or her vote share is stagnant.” While the trends Trende predicted were not always strong or consistent, they generally played out over the course of the fall campaign. On average, across the nine most competitive Senate races, Republicans gained more than twice the support (+6.5 percentage points) as their Democratic opponents (+2.5 points) as the undecided vote steadily fell.
Strictly speaking, of course, these trends do not amount to "error" in individual polls, except to the degree that consumers of the data expect early polling snapshots to constitute forecasts of the election outcome. Rather, the gains seen for Republican candidates during the fall of 2014 exemplify pre-election polls performing as intended, tracking the campaign dynamics as typically lesser-known Republican challengers engaged with voters and gained support.
That said, the observed trends alone cannot do not explain the understatement in most races, except to the degree that polling models used by Pollster and other aggregators may have given greater weight to polls that missed a late trend to the Republicans.
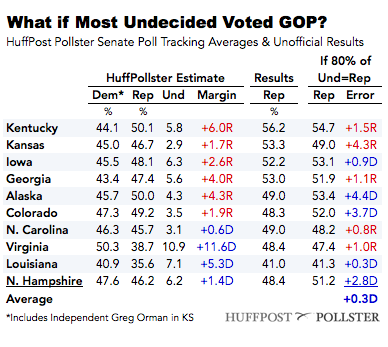
A second theory, essentially an extension of the first, holds that whatever vote remained undecided at the end of the campaign "broke" heavily or even entirely to the Republican candidates. "Often in wave elections," Quinnipiac pollster Peter Brown explained, "virtually all the undecided or extra party voters go the same way.”
This theory works, at least in terms of simple arithmetic, in most of the Senate contests that produced the biggest errors on the margins. In Kentucky, Iowa, Georgia, Virginia, and Louisiana, allotting 80 percent of the undecided to the Republican candidate would reduce the error on their share of the vote to a percentage point or less. Of course, allotting nearly all of the undecideds to the Republicans also makes for an overstatement of their support in states where the polling was collectively accurate, such as Colorado, Alaska and New Hampshire. It's not clear why the 2014 election would have produced a near uniform "break" of undecideds to Republicans in some states but not others.
The bigger problem is that an 80 percent or greater allotment of the undecideds to any candidate is unlikely given what decades of prior research have taught us about undecided respondents. They are typically are not engaged in politics and demonstrate low awareness of most political issues, suggesting that a large number do not actually vote. The precise number is difficult to estimate, but a recent YouGov analysis found roughly a quarter of those still undecided on their final round of Senate surveys said they did not vote in 2012 and roughly two-thirds were self-described political independents (The portion of undecided voters who don't end up voting is likely even higher on telephone surveys, since YouGov offers "undecided" as an option, while most phone surveys don not).
A third theory is that the mechanisms pollsters used to select likely voters or model the likely electorate overstated participation by Democrats. "Part of the reason why the public polling in 2014 was so bad," Democratic pollster Anna Greenberg explained at a post-election panel in Washington on Thursday, "they basically took anybody who was willing to take a poll. When you have turnout at 36.6 percent and you take anybody who is willing to take a poll, you have got a lot of people in your surveys who are non-voters."
Generalizing about the mechanics of likely voter models is difficult, since pollsters differ widely in their approaches, but most apply some degree of judgement about either the overall level of turnout expected or calibrate their models to the turnout patterns of past elections. The lower turnout in many states, as compared to 2010 -- and the anecdotal evidence that turnout among core Democrats was especially low in states like Virginia -- suggests that polls may have included more non-voting Democrats than Republicans.
Pollsters have long understood that they cannot predict with 100 percent certainty which of their respondents will vote and which will not. The best they can do, through a variety of different approaches, is to maximize the number of actual voters and minimize those who do not turn out.
To get a sense for how non-voting among poll respondents might throw off the results, consider a hypothetical scenario involving polling on Virginia's Senate race. Start with a final polling average that put Democrat Mark Warner ahead of Republican Ed Gillespie by eight percentage points (48 to 40 percent) on Election Eve, with 2 percent for Libertarian candidate Robert Sarvis and 10 percent undecided (using Pollsters's classic regression trend lines, which did a better job than our poll tracking model in picking up the late trend to Gillespie). What if roughly one in five of the survey respondents didn't vote, and if the non-voters who made it through the survey screen were more likely to say on the poll that they supported Warner rather than Gillespie? Both assumptions are reasonable given prior research that validated respondent turnout and early reports on Virginia's turnout.
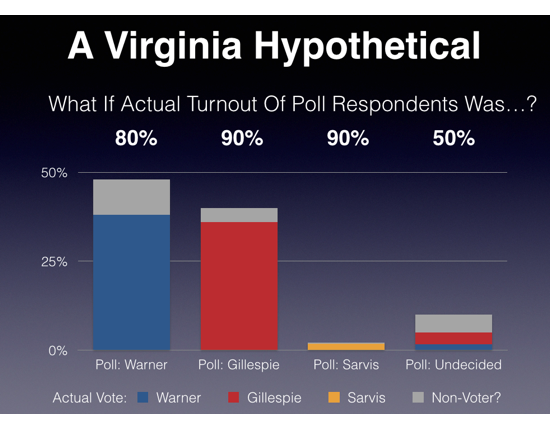
If we assume that that roughly half the undecided respondents interviewed by pollsters actually voted, compared to 90 percent among Gillespie and Sarvis supporters and 80 percent of Warner supporters on the poll, and we remove the hypothetical non-voters, the margin gets much closer. If we then allocate the remaining 5 percent undecided to favor Gillespie by a 2-to-1 margin and recalculate so the percentages total to 100 percent, the result is a one point Warner lead (49 to 48 percent, with 2 percent for Sarvis), roughly Warner's current margin in the unofficial returns.
For pollsters who drew their samples from official lists of registered voters, and who were careful to match individual respondents to their voter file records, these last two theories can be tested. Once election officials update their lists, these pollsters can determine which of their respondents voted and which did not. If turnout introduced a "skew" into the results, they will know.
MOST SUPPORT GIVING CONGRESS MORE POWER TO LIMIT CAMPAIGN SPENDING - HuffPollster: "Most Americans say they think the billions of dollars spent on campaigns affected the outcomes of the 2014 elections, and they support changing the Constitution to allow for more limits on spending, according to a new HuffPost/YouGov poll. Americans are more than three times as likely to say that elections are generally won by the candidate who raises the most money as they are to say that they're generally won by the best candidate. Two-thirds also said super PACs had at least some influence on the results of the 2014 midterms, with 39 percent saying they had a great deal of influence. Fifty-two percent said that limiting contributions to political campaigns would help prevent corruption in politics….A 53 percent majority of Americans, including 64 percent of independents and 48 percent of Republicans, support a constitutional amendment giving Congress more power to create restrictions on campaign spending. Twenty-three percent oppose the idea, and 22 percent are unsure." [HuffPost]
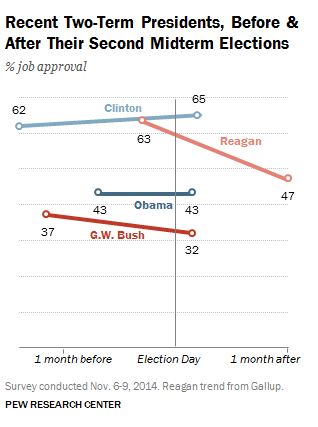
OBAMA'S APPROVAL RATING REMAINS UNCHANGED - Seth Motel: "The midterm elections that handed losses to many Democrats across the country haven’t resulted in much change for President Obama’s approval rating – it has barely moved in over a year and remains at 43%. In fact, the share of Americans approving of Obama has wavered between 41% and 45% in 13 consecutive Pew Research surveys dating back to September 2013. While Obama’s recent job approval isn’t high by historical standards, his second-term numbers overall have been more stable than those of his predecessors. Although many factors contribute to a president’s approval in the public’s eye, it often declines after an election when a president’s party loses." [Pew]
HUFFPOLLSTER VIA EMAIL! - You can receive this daily update every weekday morning via email! Just click here, enter your email address, and and click "sign up." That's all there is to it (and you can unsubscribe anytime).
FRIDAY'S 'OUTLIERS' - Links to the best of news at the intersection of polling, politics and political data:
-Most Americans think both parties should compromise, but few expect them to do so. [National Journal]
-Americans expect the new Congress won't get much more accomplished than the current one. [YouGov]
-A post-election poll finds the American electorate still gloomy. [PRRI]
-An internal poll for Bill Cassidy gives him a 16-point lead over Mary Landrieu in the Louisiana runoff. [The Hill]
-Brendan Nyhan explains why the "bully pulpit" may be counterproductive on net neutraility. [NYT]
-Gene Ulm (R) argues that Democrats lost the ground game. [POS]
-Two political science grad students argue campaigns could do better at the ground game. [Vox]
-Brier scores show "paper-thin" differences in the accuracy of forecasts of 2014 governor races. [DailyKos]
-A Tumblr of "big data" images. [BigDataPix via Flowing Data]
Before You Go
