
We might pick up a few very late polls this election morning, but even so, it is well and truly time to list some forecasts.
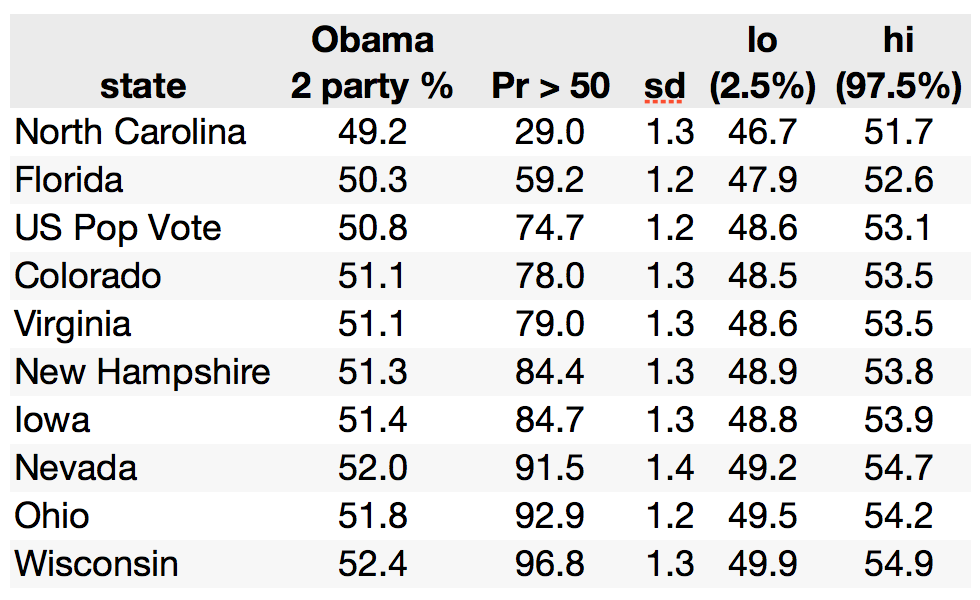
National popular vote. The last run of the model tonight produced 50.8% two party vote share for Obama. Since this is a two party estimate, the Romney estimate is 49.2%.
Modeling proportions of "Other", "Undecided", "DK" has never been a prominent piece of the work I've done for Pollster over the campaign. Estimates of these segments of the electorate are largely dominated by house effects, and a slow downward trend over the course of the campaign.
But if pushed, we'll say 1.5% for "Other", and ramp down the two-party estimates proportionally. That is, 50.1% Obama, 48.4% Romney, 1.5% Other.
Battleground states. Obama ends the campaign with poll leads and forecast wins in all of the battlegrounds except North Carolina. We are not especially confident about the forecast for Florida, with the model estimating that Obama wins there with only 59% probability. Even the North Carolina call for Romney is not especially confident, with just a 71% chance of a Romney win. Nonetheless, in each case, our calls go with the balance of probabilities: North Carolina to Romney, but the remainder of the battlegrounds staying with Obama. Note that North Carolina and Indiana are the only 2008 Obama states predicted to fall to Romney.
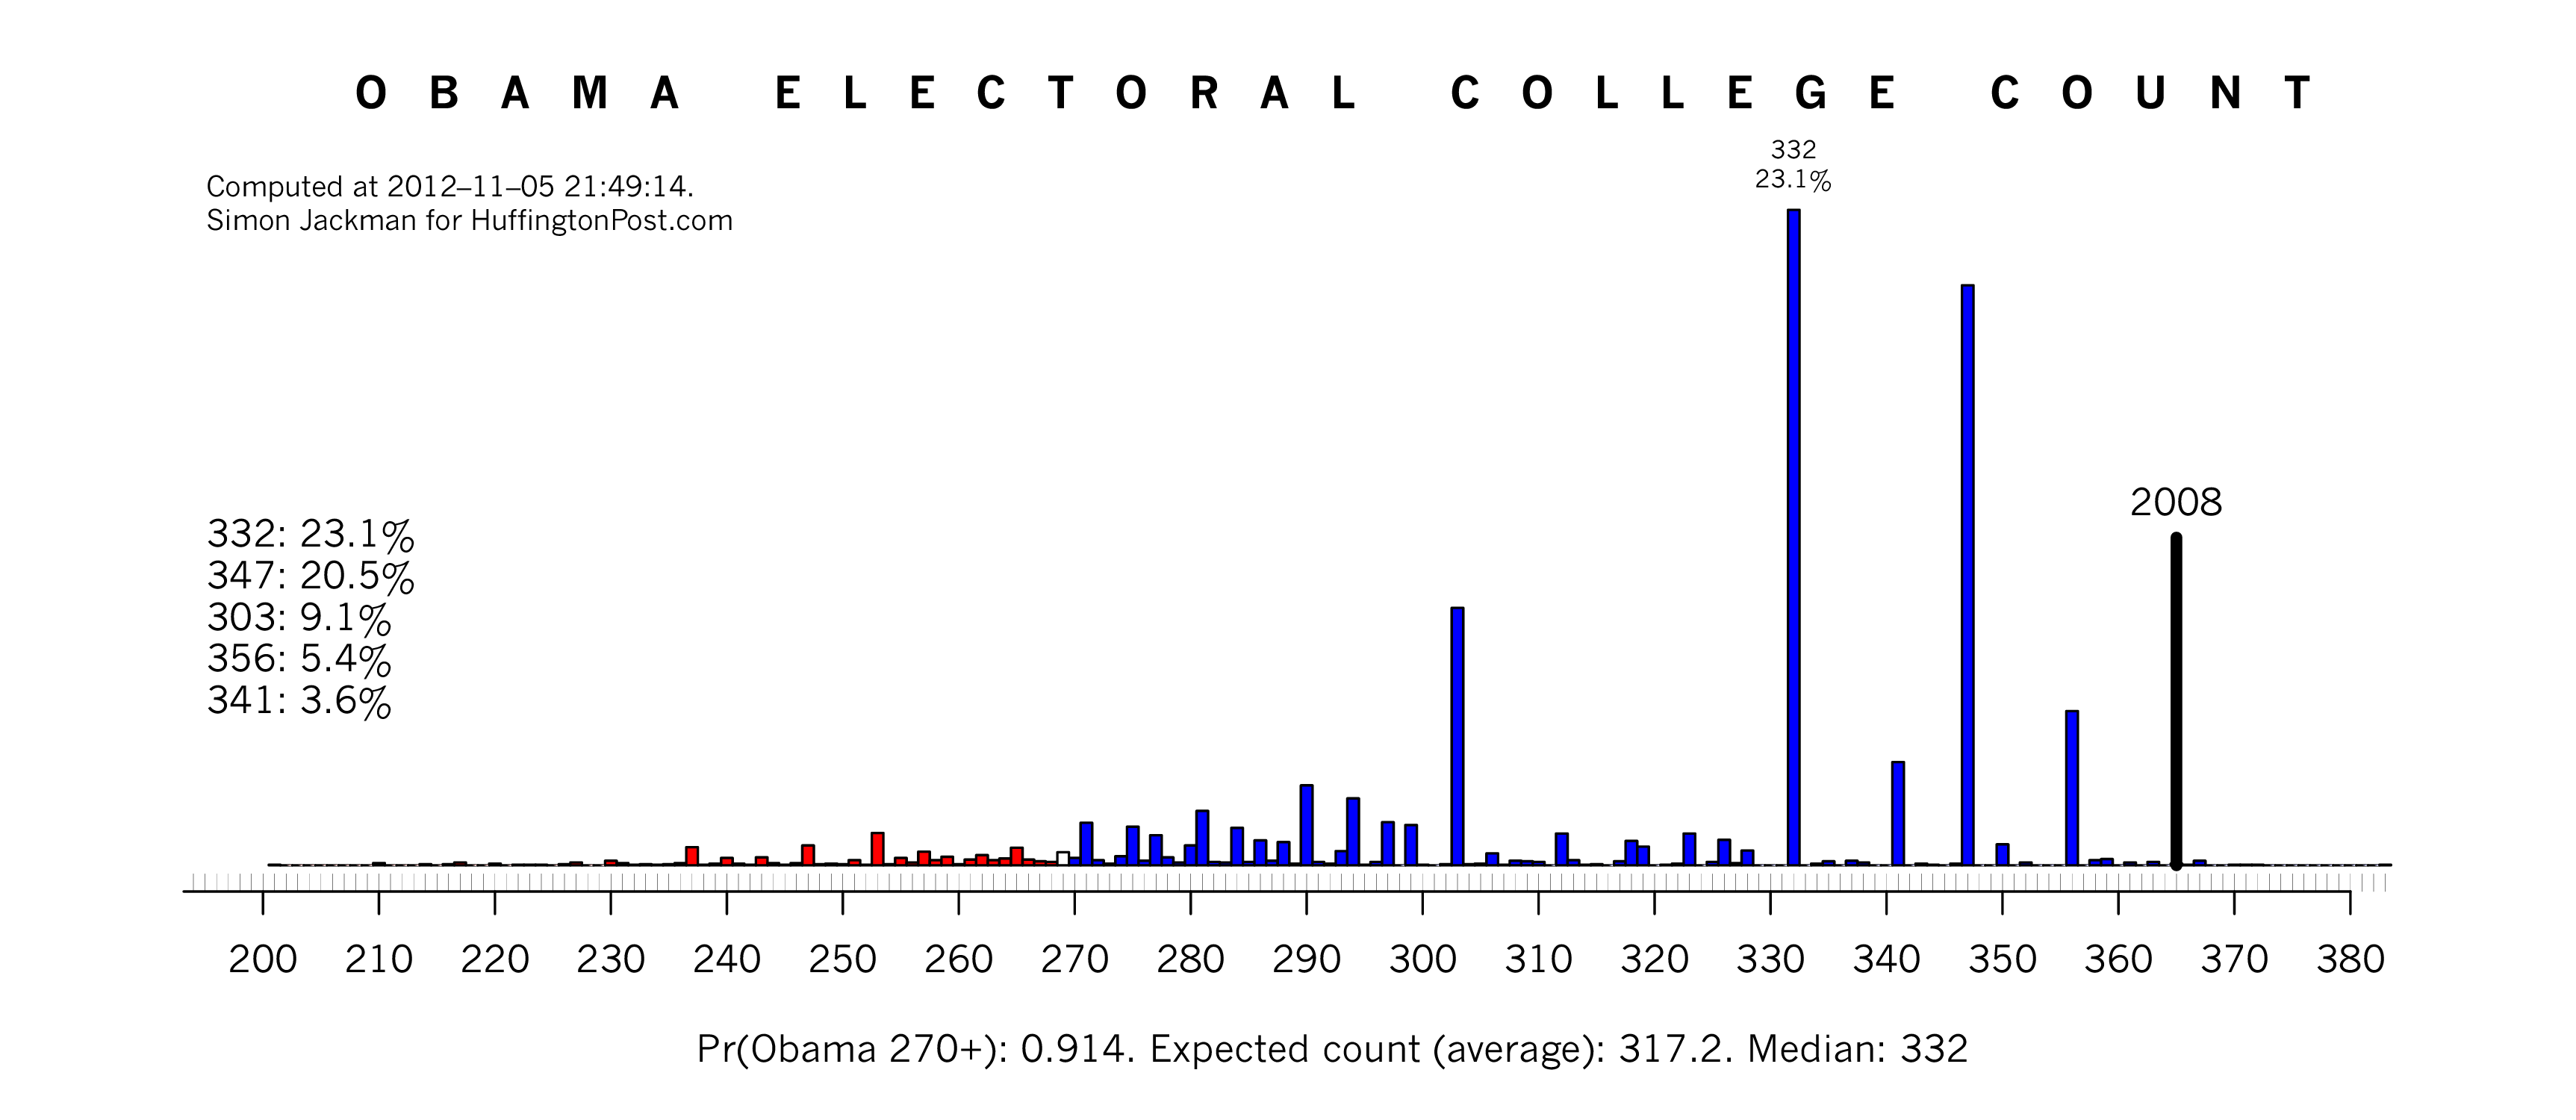
Electoral College Count. The distribution over Obama Electoral College outcomes appears below. This graph summarizes thousands of simulated elections, averaging over uncertainty in the estimated state-by-state Obama vote shares, allocating the Electoral College votes for each state via winner-take-all. There is a spike at 332 (Obama winning Florida), a slightly smaller spike at 347 (Obama winning FL and NC), and a smaller spike again at 303 (Obama loses both FL and NC).
The model confidently predicts that Obama wins the election, with the probability of 270 Electoral College votes or more now up to 91.4%.
How to summarize this distribution, so as to produce a forecast Electoral College count?
At least three choices are available to us, depending on the penalty we envisage for being wrong (what we call a "loss function" in statistical decision theory). See also Chapter 2 of my book.
- Suppose our Electoral College count is to be graded as a count per se, with performance graded by how close we get to get the count (not a binary "right/wrong" scoring rule). If the penalty for error in our predicted count increases quadratically (not linearly), then statistical decision theory says we should use the mean, 317.2, as a point estimate. The use of the mean as a point estimate here is effectively "hedging" against rare, extreme scenarios in which Obama's EV count could take on quite low values.
- If the penalty is linear (and symmetric with respect to over or under-estimates), we should use the median of the distribution, 332.
- If the Electoral College count is "all or nothing" (glory for getting it exactly right, and nothing a miss), then we should go with the modal estimate, which is the same as the median, 332.
Our sense is that Electoral College count predictions will be graded on a continuous metric, not an "all or nothing basis". The mean, 317.2, is wrong with certainty, and on that basis many would think it a dubious or even frivolous forecast; but it does hedge against our considerable uncertainty with respect to the outcome in Florida (and other states, for that matter). The median of 332 is rationalized by linear loss -- as well as being the "no guts, no glory" estimate.
I would point out that it is hard enough coming up with an Electoral College count prediction (or maybe not, given the run of polling for Obama in the last few days), let alone trying to guess the loss function with which others will "grade" the performance of forecasts. Researchers at the University of Pennsylvania contacted me (and others in this business) seeking my probabilistic forecasts for battleground states; I'm more happy to send these along and will do so after one last look at any last minute polls released tomorrow morning. The researchers said they would use Brier scoring to assess the probabilistic forecasts. Were it always the case that the rules of the forecasting game were always made so clear.
Technical digression: a clarification. My Twitter feed has been busy with inquiries about how I do the Electoral College simulations. I replied a little tersely to some of these inquiries ("what is it about conditional independence that you don't understand?"; well, not literally, but...). I now understand that the fault is mine, that my exposition of the simulation methods I employ contained errors, and I apologize.
Here's the story. The model uses poll data (and house effect corrections) to generate estimates of Obama and Romney levels of support in the states (and at the national level). The modeling is done simultaneously: if you will, there are up to 52 latent quantities (e.g., Obama support in 50 states, the District of Columbia, plus the national level) moving over time, with polls giving us (noisy) snapshots as to where the latent targets might be on any given day. Patterns of correlation in historical election results supplies prior information as to which latent targets are more likely to move together than others. The national trajectory is estimated with considerable precision (e.g., there is so much national polling in the last few months of a presidential election); moreover, by construction, fluctuations in the national level target will be correlated with state level fluctuations. Quite aside from the prior, historical information, the polling data strongly suggests correlated trajectories across states. All this is to say is there is a lot of "correlation across states" baked into the model.
Now, to generate a distribution over Electoral College outcomes, I sample repeatedly from the joint distribution of the latent quantities on a given day. Obama's level of support in Ohio on day t is correlated with Obama's level of support in, say, Iowa on that day (and in many other states too). For a given draw from the joint distribution, I simply note if Obama > Romney in state j = 1, ..., 52; if so, then I assign the Electoral College votes for state j to Obama, otherwise to Romney. Because I sample from the joint distribution for Obama support levels across states, the simulated Electoral College outcomes are likewise correlated. I do not compute the probabilities that Obama > Romney in each state (averaged across Monte Carlo samples) and then flip state-specific coins independently.
I apologize for misleading readers in previous attempts to describe the modeling and simulation algorithms that underlie it.