

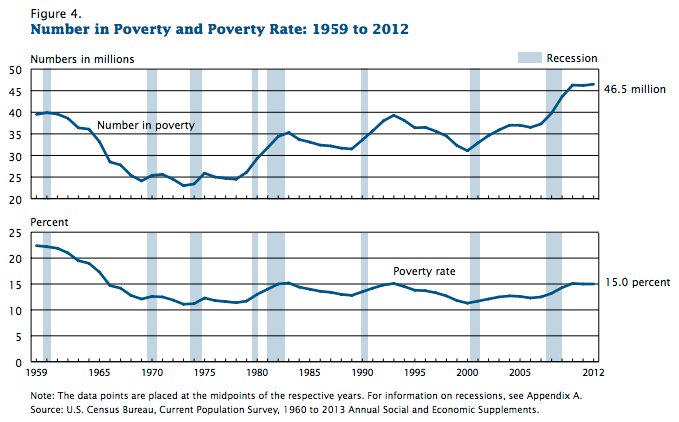
The U.S. poverty rate was essentially unchanged at 15 percent in 2012, as roughly 46.5 million people were stuck living at or below the poverty line, the U.S. Census Bureau reported Tuesday. This marks the second straight year that both the poverty rate and total number of people living in poverty were stuck at their current levels.
From the Associated Press:
"It was the sixth straight year that the poverty rate had failed to improve, hurt by persistently high levels of unemployment after the housing bust."
Here's the long-term view of America's poverty problem, in chart form:
Many additional measures of poverty and inequality were largely unchanged last year. Here's more from the U.S. Census Bureau:
- Income: "Median household income in the United States in 2012 was $51,017, not statistically different in real terms from the 2011 median of $51,100. This followed two consecutive annual declines."
As the Wall Street Journal's David Wessel points out, that's significantly lower than it was in the late 1990s, once adjusted for rising prices:
And even lower than it was in 2007:
University of Michigan economics professor Justin Wolfers broke the numbers down by income level:
And by race:
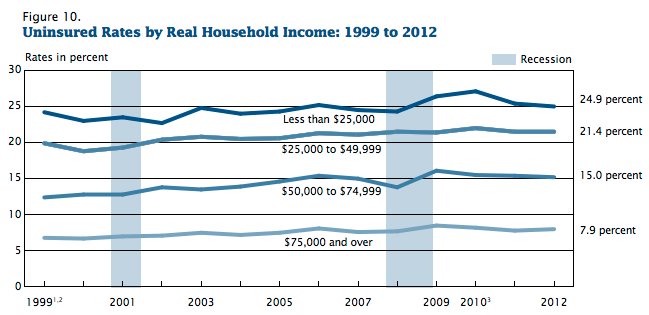
- Health insurance: "The percentage of people without health insurance coverage declined to 15.4 percent in 2012 ─ from 15.7 percent in 2011. However, the 48.0 million people without coverage in 2012 was not statistically different from the 48.6 million in 2011."
It might be obvious but should be noted anyway: The poorer you are in America, the less likely you'll be to have health insurance. Here's a chart to show that:
- Income inequality: "The Gini index [a measure of income inequality] was 0.477 in 2012, not statistically different from 2011."
In the scheme of things, inequality remains significantly higher than it was 20 years ago:
- Gender gap: Yeah, that's stuck too:
REPORT: The gender wage gap remained at 77% in 2012. http://t.co/NaiOYct3jj
— ThinkProgress Econ (@TPEconomy) September 17, 2013
Here's what that looks like in chart form: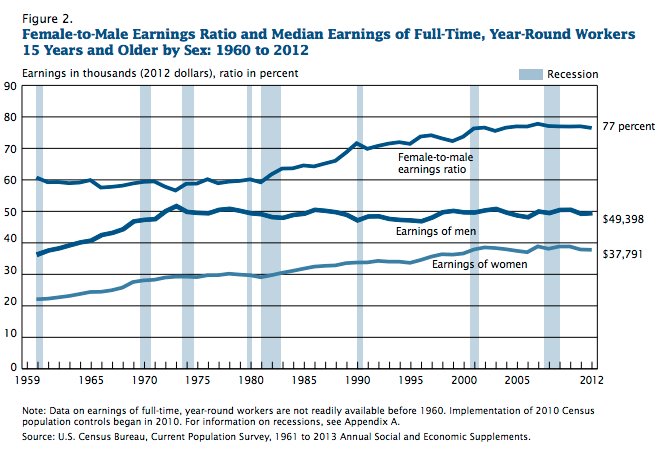
- Poverty by race: "The poverty rate for non-Hispanic whites was lower in 2012 than it was for other racial groups."
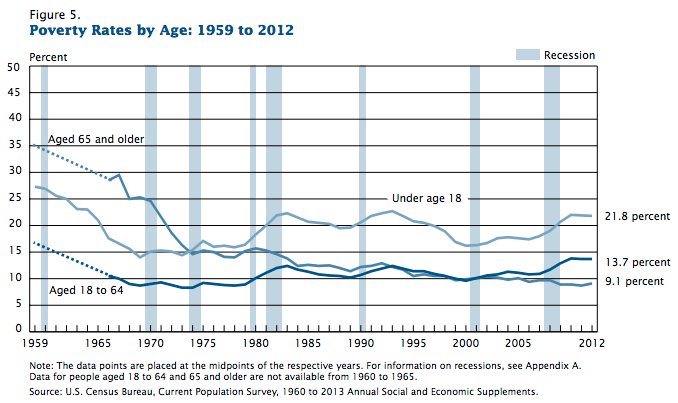
- Poverty by age: "In 2012, 13.7 percent of people 18 to 64 (26.5 million) were in poverty compared with 9.1 percent of people 65 and older (3.9 million) and 21.8 percent of children under 18 (16.1 million)."
And here's a chart to illustrate that child poverty problem:
But as Wolfers notes, sometimes a single number can be the most powerful:
Related
Before You Go
