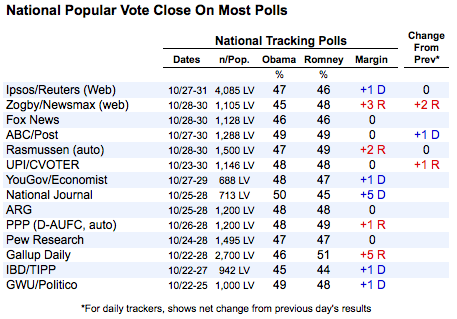
WASHINGTON -- The countdown to Election Day continues, and the pace of polling in the battleground states has increased. But the main findings remain unchanged: Though polls show an essentially tied race between President Barack Obama and Republican nominee Mitt Romney nationwide, Obama holds narrow leads in a handful of battleground states that appear poised to decide the election.
With just five days remaining, the most crucial question now may be less about last-minute polling trends and more about whether the polls will prove to be collectively accurate.
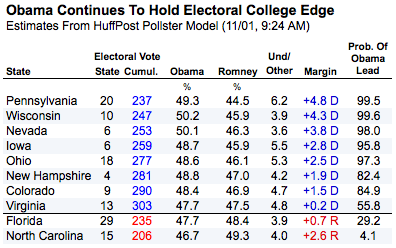
First, the new polls. In Ohio, the "Ohio Poll" conducted by the University of Cincinnati, which uses live interviewers to reach voters on both landline and mobile phones, gives Obama a 2 percentage point advantage (48 percent to 46 percent). That brings the total number of polls conducted in Ohio in the last week to 11; using a wide variety of different methods, all but one gave Obama the advantage, ranging from 1 point to 5 points.
The HuffPost Pollster tracking model, which combines state and national data while attempting to control for the "house effects," continues to give Obama a roughly 2.5 percentage point lead over Romney in Ohio.
In Iowa, a new NBC/Wall Street Journal/Marist College poll released on Thursday morning shows Obama leading Romney by 6 points (50 percent to 44 percent). Their survey uses live interviewers and calls both landline and mobile phones. Two more automated polls conducted in Iowa this week gave Obama slightly smaller margins of 5 points and 2 points, respectively.
The Pollster tracking model gives Obama roughly the same lead over Romney in Iowa as in Ohio -- just over 2.5 percentage points, as of this writing.
Obama does slightly better in Wisconsin, where a new NBC/Wall Street Journal/Marist poll shows him leading Romney by 3 points (49 percent to 46 percent), while a Marquette University Law School poll shows an even wider lead (51 percent to 43 percent). Altogether, eight of nine surveys conducted in Wisconsin over the past two weeks have given Obama advantages over Romney ranging from 2 points to 8 points, while one showed a tie. The Pollster tracking model estimate for Wisconsin, as of this writing, gives Obama a lead slightly better than 4 points (50.2 percent to 45.9 percent) over Romney.
Nationally, three of the daily tracking polls, including Gallup, have temporarily suspended out of a concern that their inability to reach as many as 60 million Americans without power as a result of the storm would compromise their ability to interview nationally representative samples of likely voters. On Wednesday, Gallup announced a tentative plan to resume calling from Thursday through Sunday nights to provide its final pre-election estimate.
Other pollsters soldiered on, such as the ABC News/Washington Post tracking poll, which reported that the new interviews they conducted in the Northeast on Monday and Tuesday were "in accord with comparable data from nights before the storm struck."

Collectively the national surveys -- many based on interviews conducted before the storm -- continue to yield the same result, a near-tie with a razor-thin edge to Romney. As of this writing the Pollster tracking model shows just 0.2 percentage points separating Romney and Obama (who get 47.4 percent and 47.2 percent, respectively).
But since the next president will be chosen by the Electoral College vote, the critical measurements are the polls in the key battleground states. In particular, Obama's narrow leads in states like Iowa, Ohio and Wisconsin, combined with other states where he leads Romney by wider margins, appear poised to give the president at least 277 electoral votes, just over the 270 needed to win.

The Pollster model reports very high confidence that Obama's leads in Ohio and Iowa are real (97 and 96 percent, respectively) but those statistics have a critical limitation: They assume the polls are just a snapshot in time and that the average of all pollster house effects is zero. In other words, they do not take into account the possibility that voter preferences could shift in the final hours of the campaign or, more importantly at this stage, that the polling averages might be collectively wrong (or in statistical terms, biased).
So with just five days remaining, what does history tell us about the potential for polling errors?
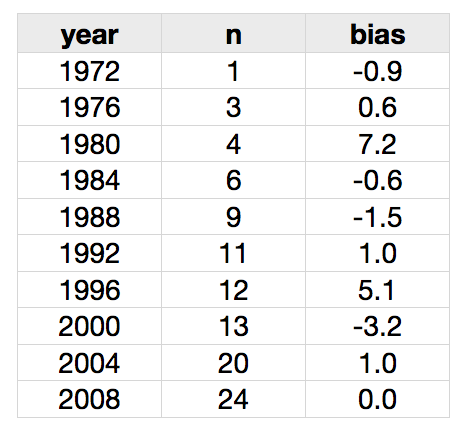
- In a recently published book, The Timeline of Presidential Elections, political scientists Robert Erikson and Christopher Wlezien examined national polls conducted since 1952. They found that the averages of polls conducted in the final week of the campaign were highly accurate in predicting the winner, though they sometimes produced errors of 1 to 2 percentage points at most on the estimates of support for the major party candidates (roughly equivalent to a 2- to 3-point error on the margins separating the top candidates).

Consider these past polling errors in the context of the 2 to 3 percentage points or less that separate Obama and Romney in many battleground states. It would take a consistent overstatement of Obama's margins -- just 2 to 3 points -- in the battlegrounds to create a scenario in which Romney wins despite the current polling numbers. History says an overstatement of that magnitude is rare but within the realm of possibility.
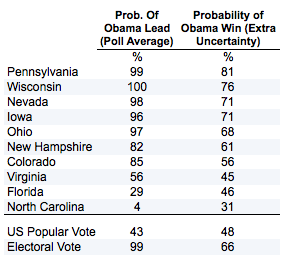
In a separate article, Stanford political scientist Simon Jackman explains in detail how he has used past polling errors to convert the Pollster tracking model's probability that a candidate leads in the polls to a probability that he will win the election.
The most recent run of the model, as of this writing, confirms the obvious: The probability of an Obama lead in the key battleground states is very high, given that virtually all polling in these states shows him ahead. However, the potential for a rare "black swan" polling failure as big as the national polls of 1980 or 1992 is still real, given past experience -- amounting to a roughly 1-in-3 chance that such an error would affect the outcome of states like Ohio and Iowa.

Over the next few days, HuffPost Pollster will try to look beyond these historical odds and assess several competing theories for why polls have erred in the past or might do so again this year.
*************************
What's happening in your district? The Huffington Post wants to know about all the campaign ads, mailers, robocalls, candidate appearances and other interesting campaign news happening by you. Email any tips, videos, audio files or photos to openreporting@huffingtonpost.com.
CORRECTION: A previous version of this article misstated a figure in the Marquette University Law School poll as 46 percent for Romney; it is 43 percent.

