
The latest public opinion poll I've conducted with colleagues at the University of Delaware's Center for Political Communication (CPC) finds that Americans strongly support voter identification laws--those which require individuals to show government issued identification when they vote.
But we also find that support for the laws depends on how they are presented to public. When ID laws are framed using arguments in support of the laws, or an argument stating that fraud is rare, the public tends to favor them at high levels. Yet, when voter ID laws are framed as taking away voting rights, the public is significantly less likely to favor them.
Results from our survey show that Americans are not very familiar with voter ID laws, and are divided on how much voting fraud exists in typical elections. Even more surprising we found that many Americans who say they are required by their state to show photo ID when voting actually live in states with no such requirement.
The telephone survey of 906 Americans was conducted by the CPC from May 20-June 6, 2012. Paul Brewer and I supervised the study.
Framing Voter ID Laws
To capture how Americans respond to common arguments in the debate about voter ID laws, we asked respondents how much they favored or opposed voter ID laws. Each respondent received only one of five different wordings, two suggesting support of the laws, two suggesting opposition to the laws, and one version with no arguments (See below). Versions of the question were randomized so as to minimize bias.
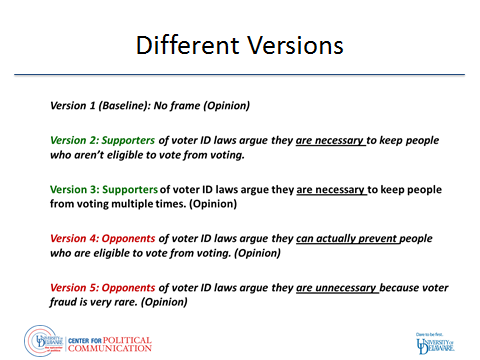
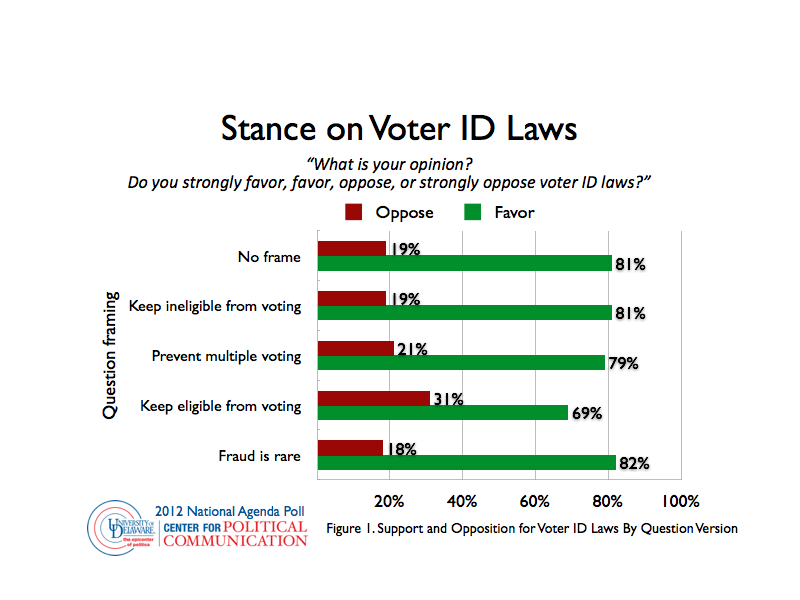
We found support for voter ID laws was the same across all wordings except the one which raised the possibility that such laws might deny a voter's legitimate rights (It said, "Opponents of voters ID laws argue they can actually prevent people who are eligible to vote from voting. What is your opinion?") This version of the question reduced support for ID laws by 12 points (See Figure 1).
Party Divisions
Only self-identified Democrats changed their support when presented different arguments about voter ID laws; self-identified Republicans did not change their views of the ID laws based on question wording (See Figure 2).
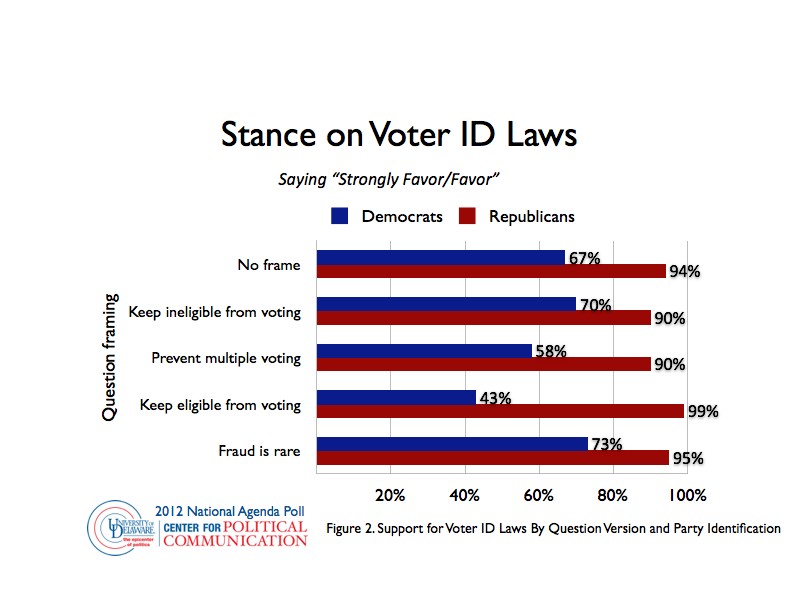
These results suggest that when these laws are discussed in terms of the denial of legitimate rights, Democrats, but not Republicans, are more likely to question their support for the laws. It also appears that arguments in favor of voter ID laws do not change opinions about them, nor do 'factual' claims about the extent of voter fraud.
Weak Familiarity with Voter ID Laws
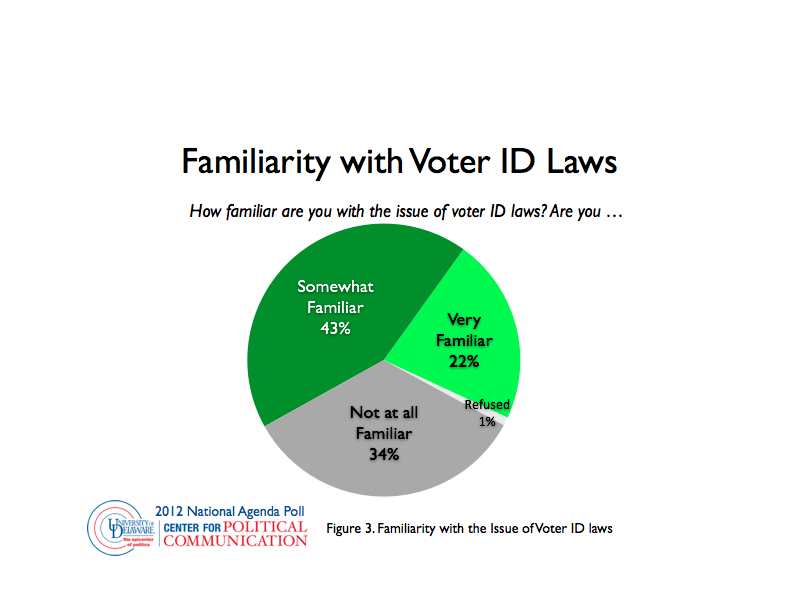
The survey also shows the public is relatively unfamiliar with the issue of voter ID laws. Thirty-four percent said they are "not at all familiar" with voter ID laws, 41 percent said "somewhat familiar," and only 22 percent said they were "very familiar." This weak familiarity with the laws suggests that many in the public could change their minds about them, particularly if evidence shows the laws might deny legitimate voting rights." (See Figure 3.)
Does Your State Require you to Show a Photo ID to Vote?
One of our survey's most significant findings is the public's perception of their own state's voter ID law. The survey found that 59 percent of the public said their state requires them to show photo ID when voting, 29 percent said their state does not require photo ID, and 11 percent said they did not know. Yet, when we compared these responses with current state laws based on the National Conference of State Legislatures (NCSL), we found large discrepancies (See Figure 4.).
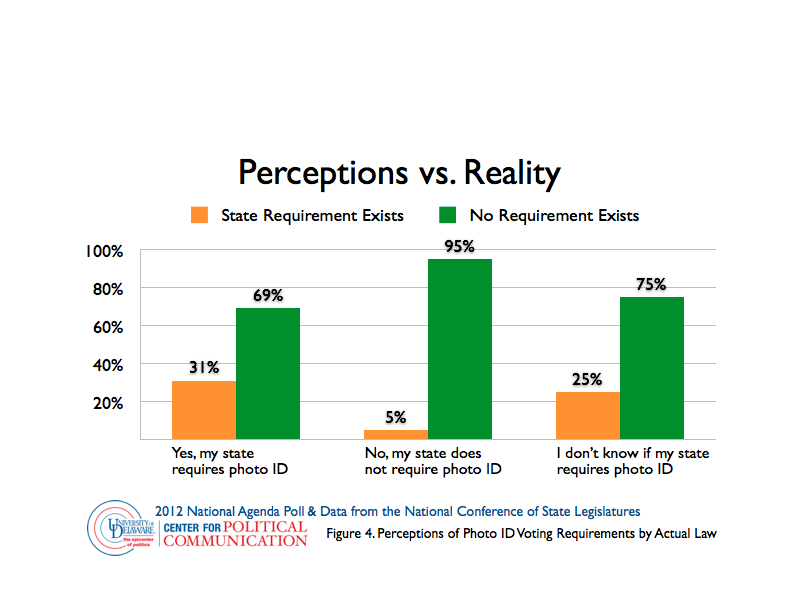
Among those who said their state requires photo only, 31 percent were correct. Among those who said their state requires no photo ID, 95 percent were correct. Among those who did not know whether their state requires ID, 75 percent are not required to show ID. These findings raise important questions about turnout. Perhaps individuals who do not have a government issued photo ID, but incorrectly believe they need one to vote will not participate in elections. Thus, even the perception that one's state requires a stringent ID can potentially reduce turnout.
Voter Fraud: Rampant or Rare?
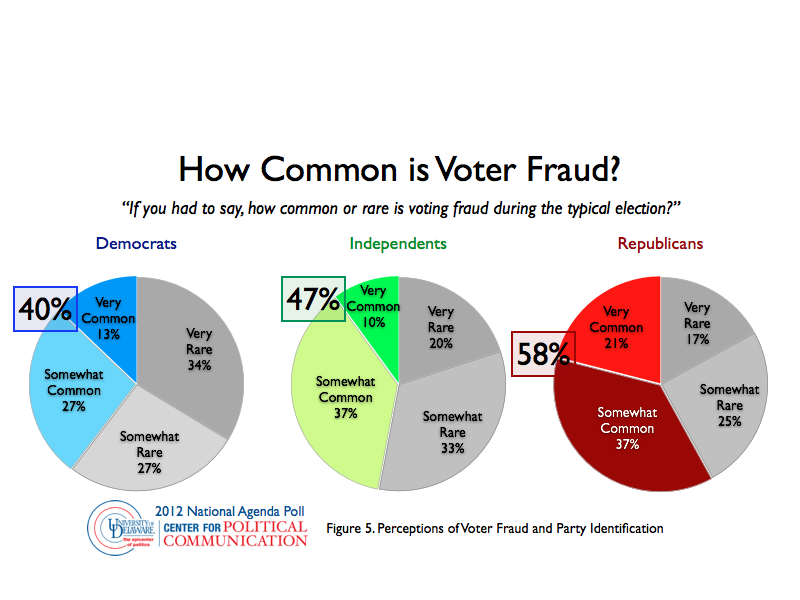
Further complicating rationales for voter ID laws, the poll found divided beliefs about the extent to which voter fraud exists. Approximately 42 percent of Americans say voter fraud is "common" or "somewhat common" in "typical" U.S. elections. Another 47 percent say fraud is "rare" or "very rare." These perceptions are sharply divided across partisan lines. Democrats believe fraud is rarer and Republicans believe it is more common. (See Figure 5.)
Take Away
It appears that many see no problem with requiring an ID to vote, but because of America's history of exclusions from voting question remains about both the intent behind the laws and the attitudes and beliefs that underlie support for them.
Misinformation about photo ID requirements, relatively low beliefs that voter fraud is common, and decreases in Democratic support for voter ID laws when they are framed as taking away legitimate voting rights all suggest support for voter ID laws rests on shaky political grounds even with high public favorability ratings.
Ultimately, public opinions on the issue are clearly shaped by those framing the debate, and there is no doubt that I and my fellow political science colleagues will keep a sharp eye on the effects of voter ID laws in the coming elections.
About the Study.
The National Agenda Opinion Project research was funded by the CPC and the UNIDEL Foundation. Results are based on telephone interviews with a nationally representative sample of 906 adults living in the continental United States. Telephone interviews were carried out using a dual sampling frame consisting of both landline (n=551) and cell phone (n=355, including 158 without a landline phone) extensions. The survey was managed by Princeton Survey Research Associates International (PSRAI), and the data were collected through English only interviews by Princeton Data Source. The data were collected from May 30 to June 5, 2012. Statistical results are weighted to correct known demographic discrepancies. The margin of sampling error for the complete set of weighted data is ± 3.9 percentage points. This estimate includes a calculated "design effect." Readers should be aware that in addition to sampling error, question wording and practical difficulties in conducting surveys can introduce error or bias into the findings of public opinion polls. Please contact David C. Wilson at dcwilson@udel.edu for more details about the survey's methodology.