The future is looking bright for U.S. solar. In 2006 the federal government launched the Solar Investment Tax Credit, a program aimed at helping homeowners adopt the clean tech without breaking the bank. Substantial improvements in photovoltaic technology mean that the cost of installing solar power has also rapidly declined, a trend that is expected to continue. Spurred on by these favorable conditions, it is no wonder that solar power has taken off in the U.S. In fact, in just the last decade alone, the rate of solar installations grew more than twenty-fold!
To better understand the regional dynamics of growth in the solar industry, we looked at over 650k solar building permits from the BuildZoom database.
Solar power production already takes place everywhere in the U.S., but its market penetration is higher in some places than in others, primarily reflecting the adoption of residential rooftop systems. The table below ranks the 40 largest U.S. metro areas by the estimated number of solar power systems per capita.
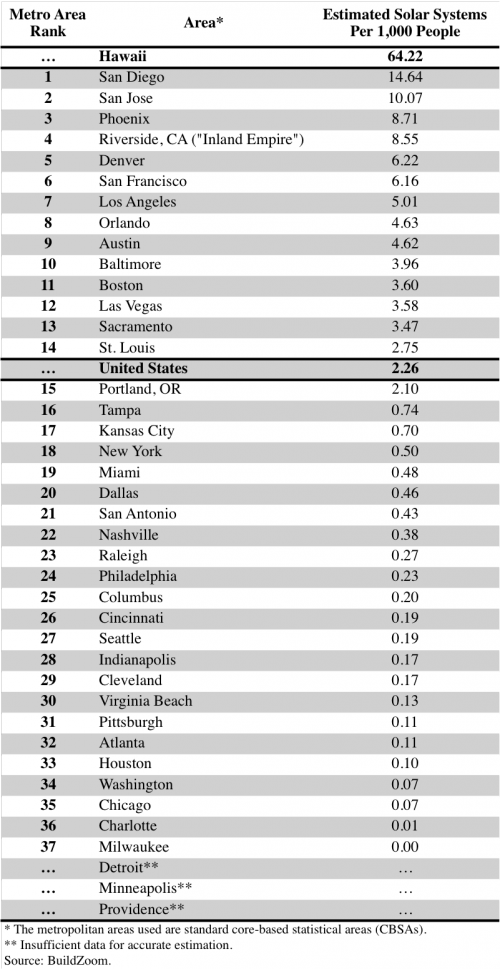
The first 14 metros on the list have more solar systems per capita than the US as a whole. Not surprisingly, 6 of the 14 are in sun-drenched California, 5 of which are in the top 10. The remainder of the list from the spot 15 down consists of metro areas with fewer solar systems per capita than the U.S. as a whole. This category includes the overcast metros of Seattle, Washington and Portland, Oregon, but it also includes places like Atlanta, Houston, and Miami.
We can also use building permits to compare broader regional trends. The chart below shows the number of building permits for new solar systems across the different regions of the U.S.

"The Golden State" remains the epicenter of the solar boom. California consistently accounts for about half of new solar power systems each year. Owing to its unique circumstances, Hawaii was quick to adopt solar, and has achieved the highest number of solar systems per capita in the country, by far. However, adapting the archipelago's grid to accommodate a mass of new solar systems is proving to be a challenge and the state's growth rate fell by more than 25% in 2014.
Perhaps the most surprising trend concerns where solar is growing fastest. Solar is growing fastest in the Northeast region, where the number of new systems more than tripled between 2013 and 2014!
Evidently, the U.S. is fast on track to becoming a large-scale adopter of solar energy. Even with the looming possibility that the federal tax credit may expire in 2016, our guess is that even if it takes a hit, solar will continue to grow.
The full report is available on BuildZoom.com.