As the holiday season slips into memory the public sector squeeze is on. We are into the shorter, colder days of winter. The American public sector is struggling through a long, cold season. Yes, the economy has made up some of the ground lost in 2008 and 2009. Yes, the recession has been declared officially over. The stock market has rallied and corporate profits have rebounded. State, local and federal government finances remain mired in pain. Cuts in services and employment are occurring and proposed across the country. Last year, total state and local employment declined by more than 400,000 jobs. An unusual number of Americans are dependent on state and local services and employees. Many millions are in poverty, seeking food assistance and qualified for emergency state and local aid. Government jobs are essential supports in many area economies. These jobs employ many victims of past labor market discrimination, offer a way up and out. State and local services are one of the few lines of defense that remain in our thoroughly tattered social safety net.
The discussion of public sector workers lately focuses on the cost. This is vital and should be open to discussion. However, we tend to forget all that we rely on these millions to do. We have also developed a dangerous inclination to discuss state and local workers as an undifferentiated mass with new specific attributes or history. This is a serious mistake as so much is now at stake and so many services and contracts are on the line.
Our 20 million state and local workers provide many vital services. These folks provide education, fire, police, clerical, court/legal and social services. Major coming battles are to be fought over which state and local jobs to cut. Who will be fired? What pensions/benefits will be cut? How many services will be cut? Who will go without? This will likely reach a fever pitch as the federal debt ceiling is reached in March/April and the state and local fiscal year ends in June.
Sometimes pictures are worth 1,000 words. This also goes for graphs. Below is a sketch of state and local workers. Few of the recent discussion really ask how many state and local workers there are. What do these people do? What are the pay levels? Who are these people? Conversation is usually dominated by ideologically and politically inflected diatribe.
How many state and local workers are out there?
Figure 1. State and Local Employment Bureau of Labor Statistics CES
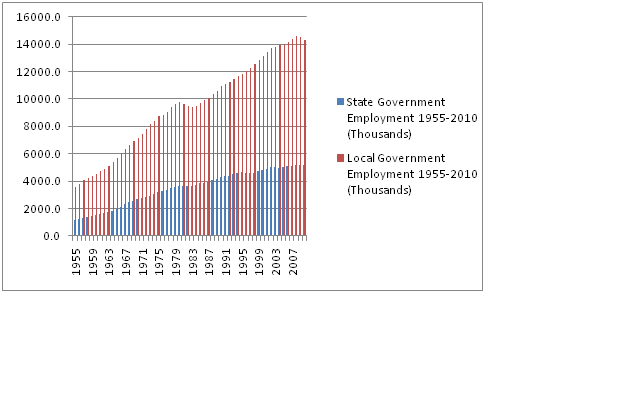
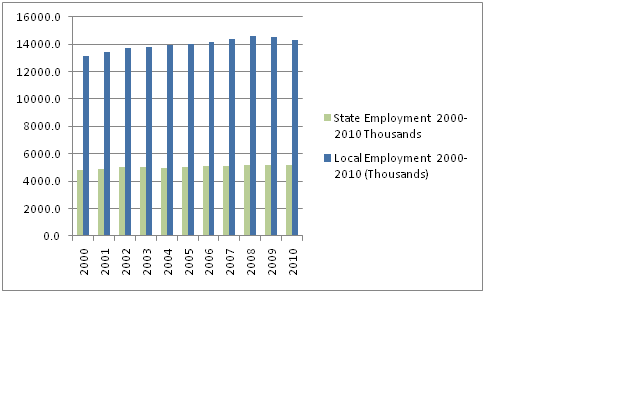
Figure 1 makes clear that there are about 20 million state and local workers in America. There were 14.3 million local workers at the start of 2011 and 5.2 million state employees. There has been a steady rise in state and local employment over the last half century. Growth has not been particularly rapid over the last decade. Figure 2 speaks to relatively flat employment levels at the state and local levels in the new millennium. Growth in state and local employment has occurred as population has increased and past social movements have won expanded benefits. The very high cost of medical care and social problems associated with crime, drugs, lack of affordable housing have added to costs. Public education -- at all levels -- has also grown as a cost to state and local governments. Our massive networks of jails, parole officers, probation officers and prisons have grown rapidly. The relative strength of state and local employee unions in some areas has also contributed to employment growth. Most American communities rely on a host of state and local services as well as employments and incomes that flow directly and indirectly from state employment. In some communities these jobs and services produce and support much of the local middle class.
Figure 2. BLS Data State and Local Government Employment 2000-2010 (Thousands)
In 2009, the latest available data, the average state employee earned $23.67 per hour, $49,240 per year. The average local government employee earned $21.68 per hour or $45,090 per year. These averages hide large differences in pay by location, age and job type. The national average earning per hour for all employed Americans in December of 2009 was $22.38, $44,760 for a 2,000 hour year. State and local government employees earned about the national average per hour in 2009 and 2010. State and local workers, particularly in the six states with the highest levels of unionization, received better benefits than the average private sector worker in a similar job. Public sector workers are more likely to receive benefits than those in the private sector. Benefits have been negotiated up by these workers as an alternative to higher wages in many localities and cases. The value of benefit packages adjusts with the costs of health care, prescription drugs and returns on pension investments. Benefits in public sector work continue to be in line with historical middle class benefit levels. However, there has been significant erosion in benefits for many private sector workers since the 1980s. Thus, public sector workers often have more generous benefit packages than their private sector counterparts.
What services do state and local workers provide?
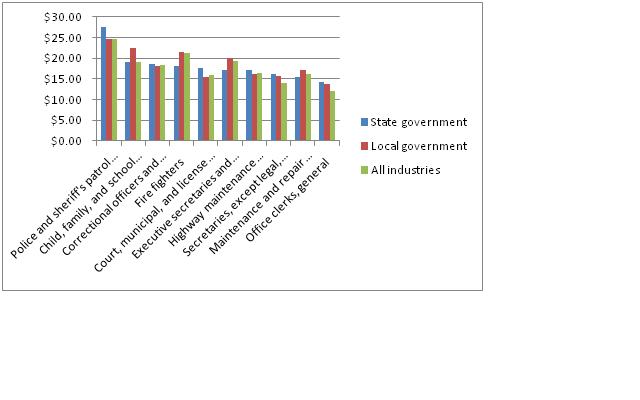
The jobs most commonly performed by state and local employees include education/teaching, law enforcement/public safety, fire protection, transportation, social, legal/court and medical services, clerical services. Figure 3 below lists the most common jobs and salaries for state and local employees according to the BLS Career Guide to Industries, 2010-2011 Edition. State and local government employee earnings were close to the national averages in most occupations. The annual earnings of most state and local workers track and move fairly closely with average earnings in the private sector. There are some exceptions and these usually have resulted from particular local political struggles and circumstances.
Figure 3. Most Common State and Local Government Occupations and Mean Hourly Compensation
Demographic Features and Context
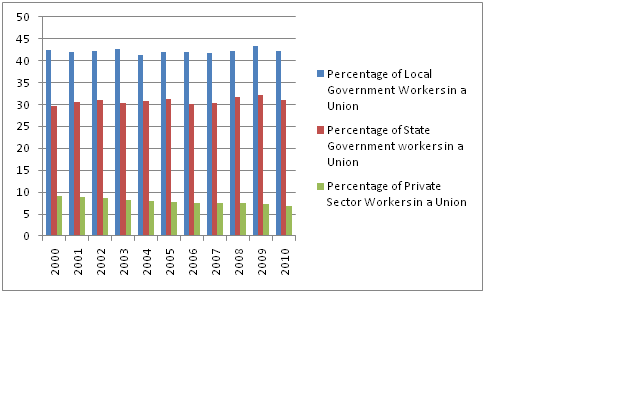
State and local workers are heavily unionized. Cuts in employment, wages and benefits at all levels of government will dramatically decrease the proportion of union employment in the US. As this goes to press 12.3% of Americans are represented by unions, 14.7 million people. This number declined by 612,000 across 2010. The rate of unionization has been falling since 1983, when these numbers began being tracked by the BLS. 2010 marked a new low with 11.9% of workers represented by unions, down from 20% in 1983. 36% of public sector workers were unionized in 2010 and 6.9% of private sector workers were in a union. More than half of all unionized workers are in the public sector. In 2010 7.6 million public sector workers were unionized and 7.1 million private sector workers were unionized.
Six states: New York, California, Illinois, Pennsylvania, Ohio, New Jersey contain more than half of all union members. Rates of union membership are lowest in the Southeastern US where many states have less than 5% of their labor force in unions. Given the dramatic overrepresentation of unions in the state and local public sector, any major shift in employment in this sector will immediately and profoundly shift the role and size of unions in America.
Figure 4. BLS Data % of Workers Unionized by Employer Type
State and local employees have several demographic attributes that are not seen universally in the working public. African Americans have higher rates of government and union employment because of their concentration in regions and occupations covered by state and local unions. African Americans have a higher rate of state and local employment and a higher rate of unionized employment than the population average. Equal Opportunity Employment Committee data from 2007 suggests that 18% of full time state employees are black. At the city level, the same EEOC data suggest that 19% of full time employees are black. Major shifts in employment at the state and local level are likely to disproportionally impact communities of color- particularly African American communities. There is a unique history behind high levels of African American employment in many states and locales. This history emerged out of civil rights struggles and past patterns of severe employment discrimination against African Americans in hiring. Ethnic demographics of state and local employees display this pattern among historically abused ethnicities and women.
Veterans are significantly overrepresented in public sector employment, including at the state and local level. In 2009, nearly 13% of all employed veterans worked for state and local government. Public sector employees tend to stay at jobs longer and tend to be older than private sector workers. Public sector workers are statistically more likely to be older, to be veterans, to be from communities of color and to be concentrated in urban areas of the Mid-Atlantic, West Coast or upper Midwest. These groups will be uniquely hurt by significant cuts in employment, pay, benefits to the public sector.
I know some of the above information is dry. However, it is essential to have a realistic conversation about who, what and where we are cutting. Needless to say, lower income and special needs populations are likely to suffer most acutely from reductions in state and local services. Restrictions and reductions on hiring and compensation will further erode the middle class and are likely to increase inequalities of wealth and income.