
The Super Bowl is soon upon us. Between the million-dollar ads will be the game that crowns the Super Bowl champion and will etch the Broncos or Panthers into NFL history. There will be the big defensive and offensive plays that lead fans cheering and others jeering. How big are plays? How can we measure if the Carolina Panthers or Denver Broncos are playing their style of game? Analytics, and specifically looking at how the teams play in portions of the field, can give us clues throughout the game as to how they are doing and who might be planning their trip to Disney by night's end.
Getting Hot on the Field
In our previous post titled, The Red Zone Exists! Just Not Where You Might Think, we performed an Equivalent Points (EqPts) and Score Type analysis on FBS college football. Through this process, we took on the task of redefining scoring success. As many football fans know, the classic measurement of scoring success is in terms of the Red Zone, but our analysis led us to the creation of two new zones of significance in terms of scoring success.
The first zone we defined is called the Orange Zone. The Orange Zone ranges from midfield to the opponent's 15-yard line and is the area of the field where a 1st down in this region indicates that a team's chances of scoring are greater than not scoring based on FBS drive averages. Additionally, EqPts values in the Orange Zone range from 3 to 5 points. Given that the chances of scoring are greater than the chances of not scoring, and that the value of a 1st down in this region of the field is worth greater than or equal to a field goal, we defined success in this zone as a score of some type (field goal or touchdown).
The second zone we defined is called the Hot Zone. The Hot Zone includes the area of the field from the opponent's 15-yard line to the opponent's goal line. In the Hot Zone, given a 1st down, one's chances of scoring a touchdown are greater than scoring a field goal or not scoring, and the EqPts values range from 5 to 7 points. Therefore, a touchdown is deemed as a successful result in terms of averages in the Hot Zone.
The NFL: Why this matters?
On Sunday night, it won't be college athletes competing on the gridiron, but rather some of the most talented professional football players in the world. The skill sets of these players are superior, and even the style of play in the NFL differs from that of college football. The differences are many, but college football and the NFL share much more in common statistically than one might believe. As mentioned earlier, our last article ventured to redefine scoring success in college football through the creation of the Orange Zone and the Hot Zone, and, as a result, create stronger characterizations of teams, but how do these zones and the numbers behind them compare to scoring data in the NFL?
The Answer: ALMOST IDENTICALLY!
Check it out for yourself.
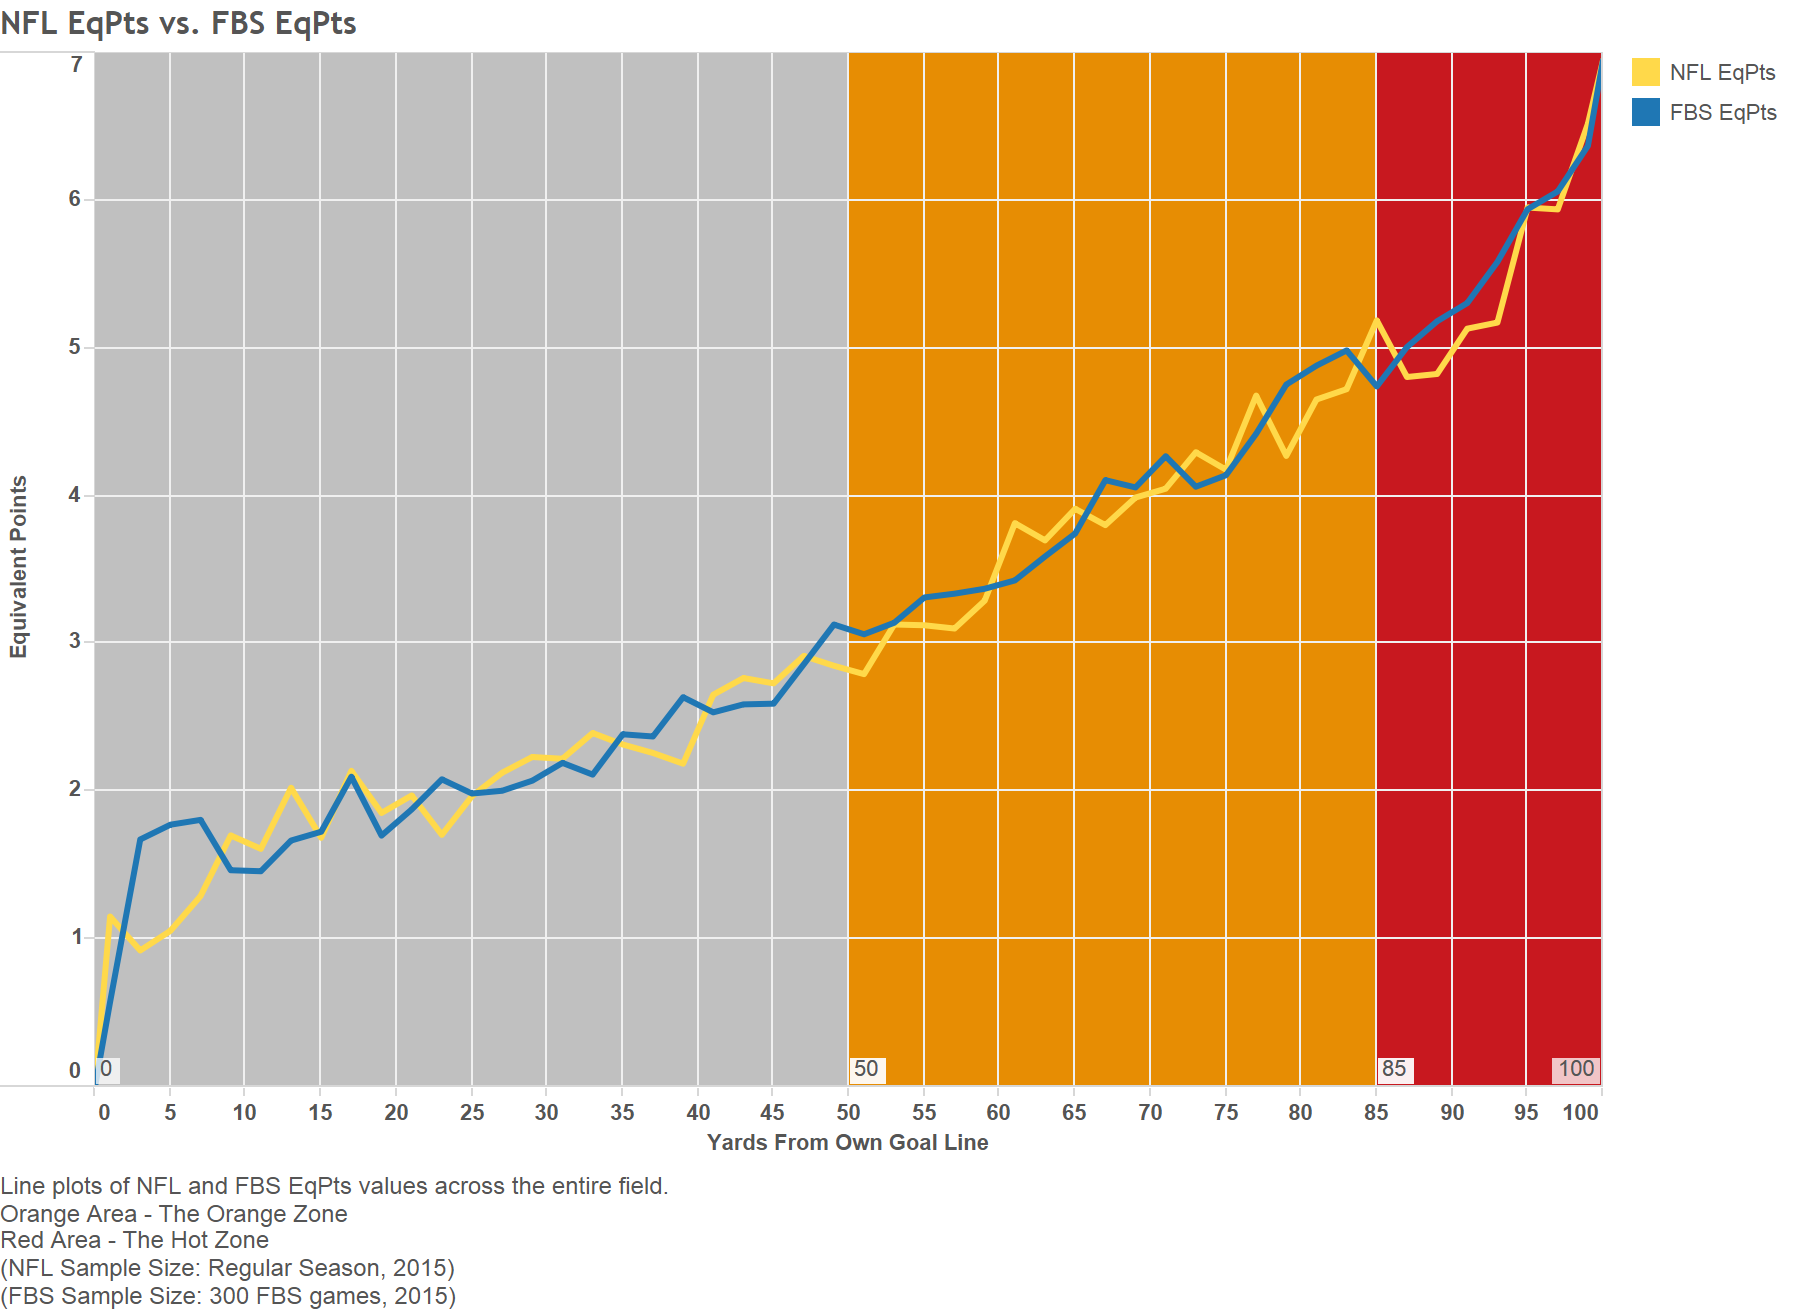
As one can see, there are many similarities in 1st down EqPts values between the NFL and FBS College Football for nearly every field position. In addition, the regions of the field where a team has a higher chance of scoring than not scoring, and where a team has a higher chance of scoring a touchdown versus not scoring a touchdown are also very similar to FBS College Football. In the NFL, the location where a team's chances of scoring begin to be greater than not scoring is at an offenses own 45-yard line, and the region where a touchdown becomes more likely than a non-touchdown occurs at the opponent's 14 yard line. While the latter field position is essentially the same as in FBS College Football, the former differs by 5-6 yards compared to college. One likely reason for this difference is due to the ability of NFL teams to score from deeper ranges given the ability of their kickers. Nonetheless, this 5-yard difference in terms of where an NFL team is more likely to score than not score has minimal effect on where an offenses EqPts value is greater than or equal to 3 (The other requirement that needs to be satisfied given our definition of the Orange Zone).
Now that we have determined that these kinds of statistics are applicable both at the collegiate and professional levels, let's look at how the teams match-up.
Hot vs. Lukewarm Offenses
Whether you're a casual NFL football fan, or a stats junkie, it doesn't take long until you come to the conclusion that the Carolina Panthers offense is good. But how good? And, how do they compare to the Broncos offense? Here's a visual that highlights the EqPts values for both teams this season in comparison to each other and the NFL average. To calculate the EqPts values for both teams, we grouped 1st downs in increments of ten yards. Not only does this expand the sample size of data for each EqPts calculation, but also it produces more representative data of each team's performances throughout the year.
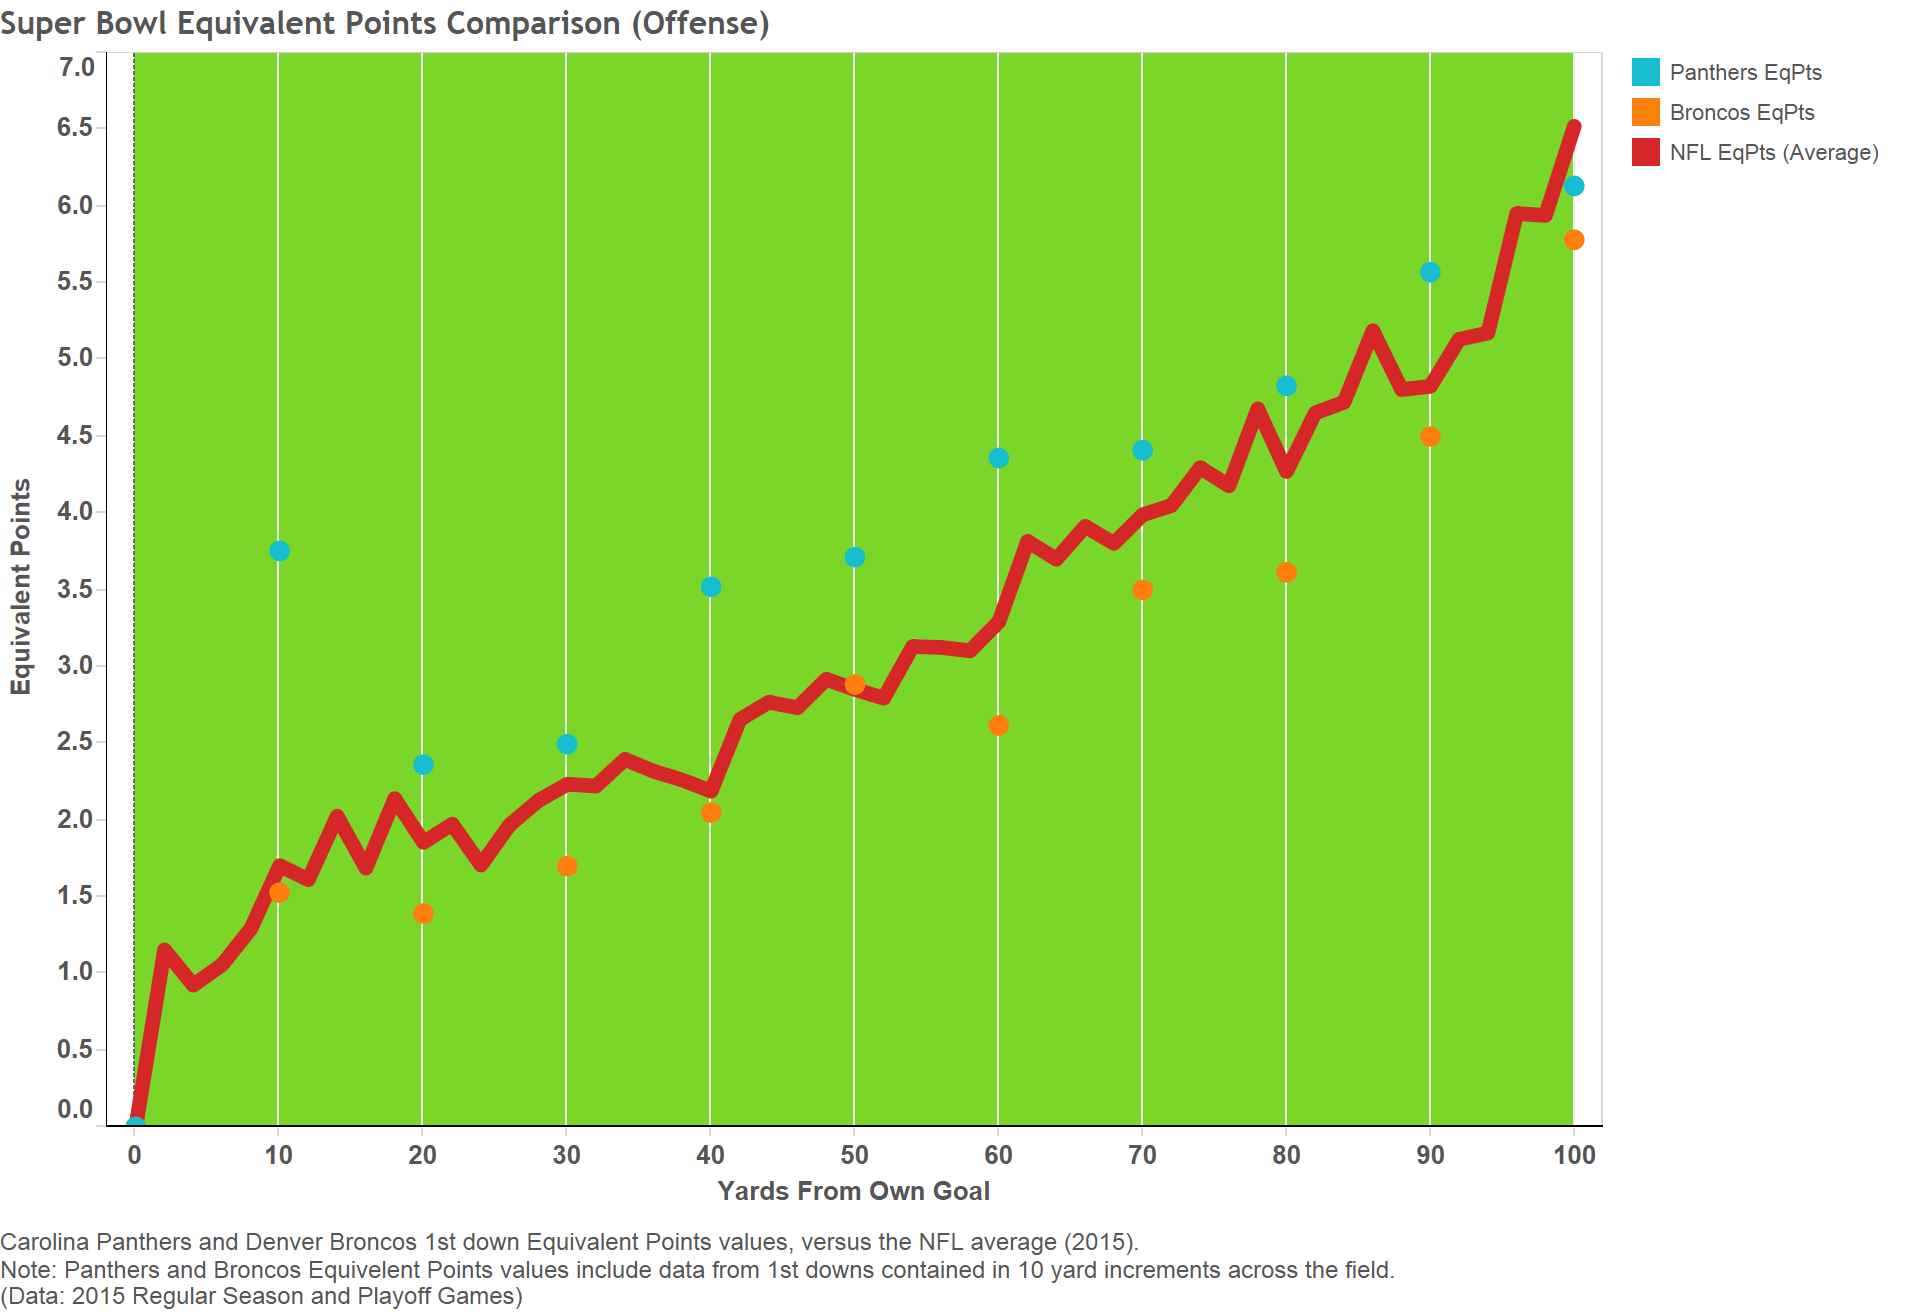
From this visual, we can quantify just how great the Panthers offense has performed this season. Nearly every EqPts measurement is well above the league average, often times by more than a whole Equivalent Point! In addition, through a comparison of the Panthers EqPts values to the Broncos, one can see that the value of the Broncos 1st down field positions are worth significantly less than the Panthers. Essentially, this says that the Panthers offense is generating more points on average from their 1st down field positions than the Broncos and the average NFL offense. To further characterize both offenses, let's take a look at their performances in the Orange Zone and Hot Zone.
The first thing to note about this Orange Zone and Hot Zone study is our sample. To reflect the Panthers recent scoring success rates, we studied data from their past 5 games, 3 regular season games and 2 playoff games. Given Peyton Manning's injuries that put him on the bench for a good portion of the months of November and December, we chose to look at Manning's most recent 5 games, in which he was the sole quarterback, as the Broncos sample size. Conveniently, Manning played in both playoff games, so the Broncos sample includes 3 regular season games and 2 playoff games, as well. From these samples we calculated the Orange Zone Scoring Percentage (OZSP), and Hot Zone Scoring Percentage (HZSP) for both teams (Recall that scoring success is defined as a field goal or touchdown in the Orange Zone, and a touchdown in the Hot Zone). The Broncos came out on top in the Orange Zone with an OZSP of 70.0%, compared to an OZSP of 64.8% for the Panthers. In terms of the Hot Zone, the Panthers show complete dominance with an HZSP of 92.3%, while the Broncos HZSP is 50.0%
To no surprise, the Panthers offense has shown to be significantly better than the Broncos in terms of EqPts values and HZSP, while the Broncos hold a slight advantage in terms of OZSP. What may be most shocking from this analysis is that the Broncos offense performed significantly lower than the league average in terms of EqPts. How does a team with a below average offense make it to the Super Bowl...? Stone-Cold-Defense.
Icy Defenses
If you were to list the best defenses in the NFL, the Carolina Panthers and Denver Broncos better make that list. The Panthers are turnover machines, creating 39 turnovers in the regular season and 9 in the post-season. To draw a comparison, the Broncos forced a total of 27 turnovers during the regular season and 3 in the playoffs. Yet, many consider the Broncos to have a better defense than the Panthers. By calculating the EqPts values for both the Panthers and Broncos opponents this season, we can show just how stifling the formidable Broncos defense really is.
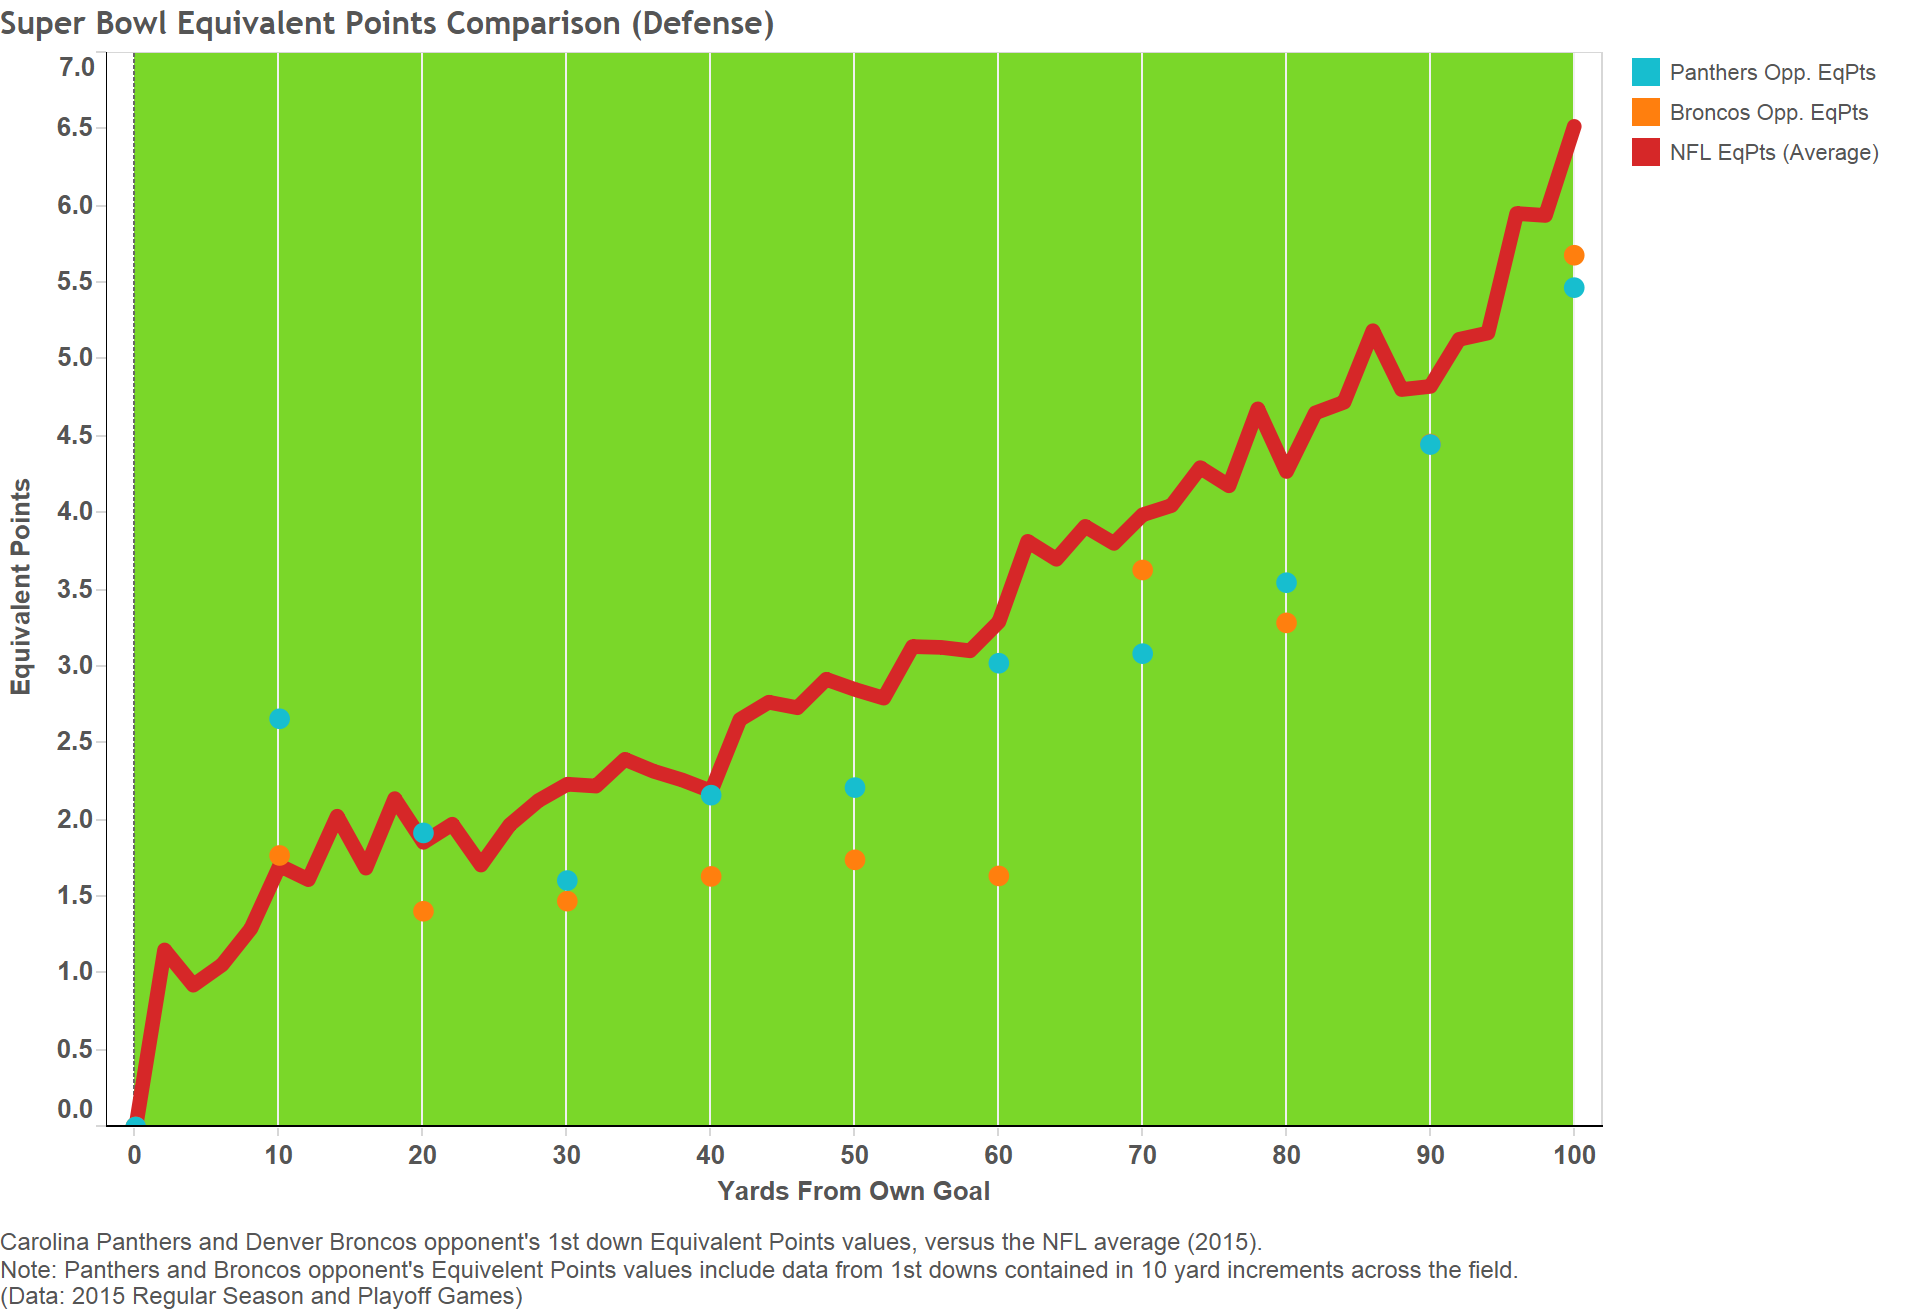
Despite the Panthers uncanny ability to force turnovers, the Broncos defense appears to be stronger from the perspective of not allowing points. Opponents on average are scoring less against the Broncos than they are against the Panthers from similar field positions. In particular, the Broncos have shown dominance against their opponents when their opposition has the ball on their own side of the field. As expected, both teams opponent's EqPts values are below the league average, providing more reason to consider both teams' defenses as truly exceptional. Certainly, much of the Panthers defensive success in terms of EqPts is a result of forcing turnovers, but for the Broncos, who created 12 less turnovers than the Panthers, the success can most greatly be attributed to a dominant defensive line that recorded a league best 52 sacks this season. In summary, the defenses of both the Panthers and Broncos will be exciting to watch on Sunday, but potentially for very different reasons.
Track the Numbers
So, enjoy the game. Critique the ads. But, keep track of how the Broncos and Panthers are performing, both offensively and defensively, in the Orange and Hot Zones. It may give you a signal of who will be pouring the cooler on their coach.