The following seeks to expound further on a May 3, 2009 Huffington Post piece, "It Will Take Years Before The Current Recession Will End."
Overview:
Christina Romer, Chair of the White House Council of Economic Advisors, said she is "incredibly confident" the U.S. economy will recover within a year. We disagree.
The objectives of this paper are four-fold: 1) To discuss the economic growth associated with the rise in the temporary, hence, artificial wealth experienced by Americans from 2001 to 2006, 2) To discuss the economic contraction which we relate to the evaporation of this "nouveau" wealth, 3) To estimate the shape of the recovery curve for the U.S. economy as America rebuilds; this time with genuine wealth production, and, finally, 4) To provide suggestions that could speed the economic recovery while simultaneously enhancing the well-being of millions of Americans.
The projections presented in this paper estimate that the GDP of $14.26T achieved in 2008 will not be achieved again until 2013 on an inflation-adjusted basis and that unemployment will not fall back to a level of 6.25% until 2016. Our recommendations for speeding this recovery are presented in the conclusion.
The Rise in "Artificial" Wealth
Beginning in 2001 Alan Greenspan and the Fed began an aggressive campaign of lowering the target Federal Funds rate as shown in Figure 1. By June 25, 2003, they had lowered this rate to a remarkable 1%. This lower interest rate led to lower mortgage interest rates that resulted in both re-financing and housing booms; in retrospect creating a housing bubble. The lower monthly payments directly translated to a homeowner's ability to buy a more expensive property for a given monthly payment. For example, a person who was able to afford a $500K home in 2000 could now qualify for a loan to purchase a $750K home. This nouveau purchasing power drove a home-buying frenzy.
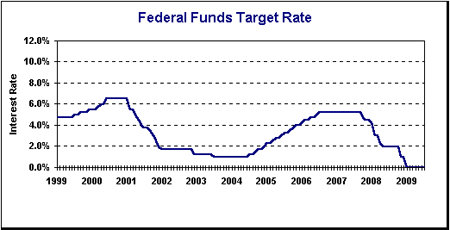
Figure 1: The Target Federal Funds Rate
This buying frenzy pushed valuations to historical highs when compared with conventional valuations, creating a housing bubble. Case in point: the ratio of total residential real estate to GDP, had been in the range of 0.52 in 1945 to 1.13 in 1999. Beginning in 2000, however, this ratio began to escalate in an almost uncontrolled manner as shown in Figure 2. These data were extracted from the Z.1 Flow of Funds Accounts of the United States [PDF]. By 2005 this ratio of GDP to Aggregate Housing Value peaked at a never before seen level of 1.72.
The key points that can be extracted from this ratio are that: 1) Housing values in aggregate became grossly overvalued by 2006 by a much larger margin than any time dating back to 1945 and 2) A correction in aggregate housing valuation had to take place, with declines back to "normal" levels
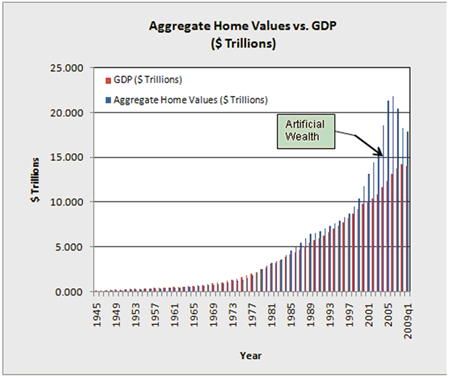
Figure 2: Aggregate Residential Housing Values compared with GDP
In order to arrive at a quantitative measure of what constitutes reasonable real estate valuations, we divide the aggregate household real estate in the U.S. by the GDP for the corresponding year as shown in Figure 3 over the same time-frame; 1946 - 2008. In this plot we've also indicated the upper and lower bands of fair valuation (FVBs) (Fair Valuation Bands). Figure 3 below indicates that in no other time dating back to 1945 did real estate valuations get so over-inflated.
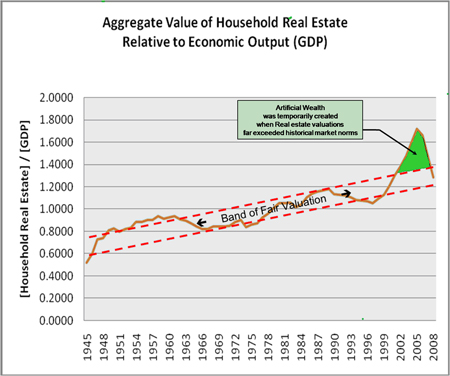
Figure 3: The upper and lower bands for reasonable real estate valuations are determined by plotting the ratio of [Aggregate Household Real Estate]/GDP. Temporary Artificial Wealth was created when real estate valuations exceeded these historical norms.
The values used to generate this plot were extracted from the Federal Reserve's Balance Sheet of Household and Non-profit Organizations, Table B.100. Each report covers a ten-year time-span.
Not only escalating prices to over-inflated levels but also by over-building drove this over-valuation of aggregate housing valuation starting in 2000. It was, however, the over-inflated home values that drove the artificial wealth effect associated with housing depicted in Figure 4. It was this newfound wealth, which empowered homeowners with additional purchasing power. It was all these homeowners' new purchases that drove up corporate revenue and earnings and hence the overall stock market. For this reason, this paper focuses on the core problem that led to the situation this country is in right now; artificial wealth created by housing.
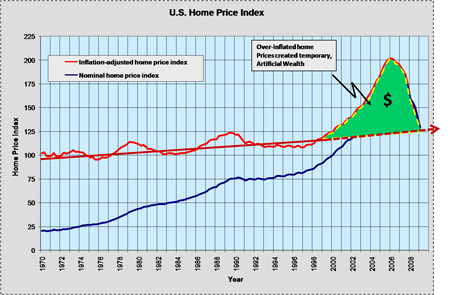
Figure 4: The artificial wealth created by residential housing is depicted as the green area under the inflation-adjusted Home Price Index (HPI) curve and bounded on the bottom by the linearly regressed inflation-adjusted Home Price Index from 1970 to 1999 and extrapolated to 1999 (dashed). The blue curve indicates the Nominal (non-inflation adjusted) U.S. Home Price Index.
Therefore, it follows that to bring aggregate home valuations back in line with historical norms, the opposite must occur; specifically, home prices must continue to fall and less new homes must be built in order to allow the over-supply to be absorbed by the market. However, before we move on to the recovery phase, let's review how this artificial wealth changed the dynamics of the U.S. economy.
Artificial Wealth and the Dynamics of the Economy
Heading into the new century, Americans grew accustomed to spending almost everything they earned. Their savings rate as a percentage of disposable income typically hovered around 2 percent between 2000 to the end of 2004. At the peak of the real estate boom in 2005 and 2006, however, the savings rate had dropped even further; averaging less than 1 percent and even went negative in Q3 of 2005. These data are plotted in Figure 5.
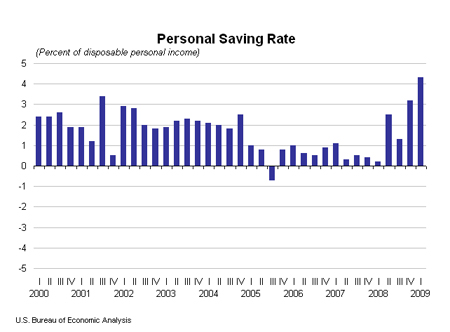
Figure 5: Personal Savings Rate as a percent of disposable personal income.
Coupled with escalating home values and looser credit policies, individuals were easily able to take on additional debt by opening up Home Equity Lines of Credit (HELOCs). These HELOCs enabled them to fix up their homes (e.g. kitchen remodels with granite counter-tops), buy new SUVs, flat-panel TVs and so on. Basically, Americans in aggregate went on a buying spree. To exacerbate the situation, homeowners were now able to refinance at low interest rates (e.g. 3.875% for a 5/1ARM). These lower interest rates lowered the monthly payments and put more disposable cash in the hands of consumers. This further fanned the flames of increased consumer demand. This inflated demand drove stock prices to new highs; e.g. the S&P 500 surpassed 1,500 on October 8, 2007.
American's 401Ks were doing very well; their home values were up; and they were flush with spending cash. So, life was good for America on average - that is until late October 2007 when the tide turned.
Americans' artificial real estate wealth started to vaporize as is shown in Figures 2, 3 and 4. The loss of value of residential real estate will now be estimated. The aggregate dollar value of U.S. residential real estate in Figure 6 was extracted from Line Item 4 of Table B.100 p. 102 - Balance Sheet of Households in the Federal Reserve Release Z-1 [PDF].
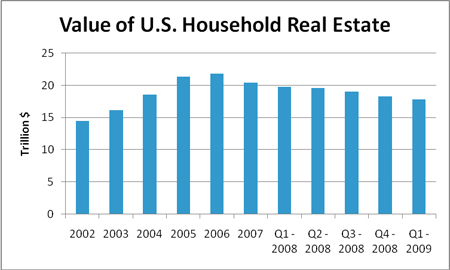
Figure 6: Value of U.S. Household Real Estate in pre-inflation-adjusted dollars. Factoring in inflation translates to an even greater loss of "artificial wealth."
Using the data from Figure 5, in pre-inflation adjusted dollar terms, the lost wealth of household real estate between the peak in 2006 and Q1 2009 amounted to $4 Trillion ($21.883T-$17.870T). We can get a more accurate estimate of the loss of real estate wealth by accounting for the additional loss in value caused by the devaluation of the dollar caused by inflation. Building on the solid work of Daniel R. Amerman, CFA, the true lost wealth from residential real estate should account for the devaluation of the dollar due to inflation. Amerman's calculations show that between 2006 and Q1 2009 inflation wiped away another $2T of wealth. Thus, the loss of wealth associated with single family residences amounted to roughly $6T.
To get a good idea of the magnitude of real estate wealth lost by an average American homeowner, Figure 7 depicts the 20 City Composite Case-Schiller Home Index. The median home price dropped by $60,000, or 32%, from $185K to $125K.
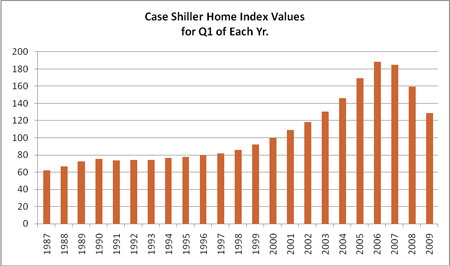
Figure 7: The Case-Schiller 20 City Composite Home Index for Q1 of each year since 1987
As Americans saw their real estate wealth evaporate, they cut back on their spending. This drop in consumption drove down corporate top-line revenue as well as earnings. This drop in corporate earnings negatively impacted stock prices. One year after the October 2007 peak, the S&P 500 dropped by 40% to 899 on October 6, 2008. Now Americans were confronted with two major sources of lost wealth; 1) Their residential real estate and 2) Their savings tied to the stock market; e.g. mutual funds in their IRAs and 401K plans. Therefore, the disintegration of this artificial wealth is really comprised of two primary components for the average American: 1) Loss of value in their personal real estate and 2) Loss of value of their financial investments. To further exacerbate the problem, the drop in home values has limited consumers' ability to obtain new HELOCs or request credit increases.
In certain instances HELOCs are either being frozen or the limits are being reduced. For example, after JP-Morgan Chase acquired WAMU (Washington Mutual), HELOC borrowers received letters requesting proof of income. For those individuals who lost their jobs, or experienced a major reduction in income, their HELOCs were frozen so that no further borrowing would be possible. Now that Americans' confidence in their ability to draw from their HELOCs has been eroded, they have become more aggressive in savings. This is both good and bad. The higher savings, hence, lower purchasing drive corporate revenues down. These lower revenues are being offset through cost cutting such as increased layoffs. America cannot rebuild its wealth on cost-cutting alone. We must create businesses that employ Americans.
A large percentage of the 76 million baby boomers born between 1946 and 1960 were not saving enough for retirement to begin with. On average they were saving even less when the were under the impression that their temporary artificial wealth was actually permanent. As they are heading down the home stretch towards retirement age, they will have no choice but to get more aggressive in their savings to make up for their portfolio losses and for the "loss" of their temporary real estate wealth. This upcoming phase of cash conservation will further put a damper on the economic recovery.
Many economists agree that full-employment corresponds to an unemployment rate of around 5%. So, let's use this as our target. To achieve this target let's look at where we stand today: The number of unemployed persons increased by 787,000 to 14.5 million in May 2009, then another 467,000 lost their jobs in June and another 381,000 in July bringing the unemployment rate to 9.5 percent . Since the start of the recession in December 2007, the number of unemployed persons has risen by over 7 million, and the unemployment rate has grown by 4.5 percentage points. This severity of this growth in unemployment is depicted in Figure 8:
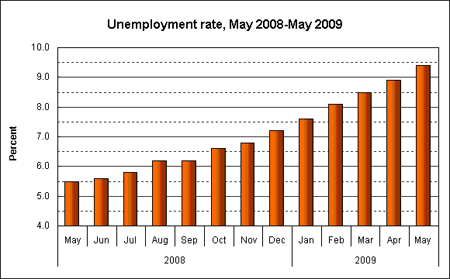
Figure 8: The growth in unemployment in the U.S.
By the last quarter of 2008, the recession rushed in with full force in the wake of the huge disintegration of artificial wealth. Individuals severely cut their discretionary spending which drove down corporate earnings and hence the S & P 500 as shown in Figure 9. The truth had clearly been revealed that much of this wealth that had been created over the previous five or six years was actually temporary and hence created an Artificial Wealth Effect (Jesus Huerta de Soto Financial Crisis: The Failure of Accounting Reform. Mises Daily. Posted on 2/4/2009).
One of the primary drivers of the explosion in artificial wealth was the loose credit policies. Individuals were able to obtain loans for which they could not maintain payments of the long-run. For example, they were able to obtain 5/1 ARMs (Adjustable Rate Mortgages) which were either interest-only or fully-amortized loans with low fixed rates for the first five years. When these rates adjusted upwards many homeowners couldn't afford the new payments which resulted in short-sales and foreclosures.
The banks got stuck holding the proverbial bag; specifically, hundreds of thousands of homes were returned to the banks' possession. This devaluation of the underlying real estate assets gave rise to toxic assets in the secondary market. Toxic assets are assets that becomes illiquid when its secondary market disappears. Toxic assets cannot be sold, as they are often guaranteed to lose money. The term "toxic asset" was coined in the financial crisis of 2008/09, in regards to mortgage-backed securities, collateralized debt obligations and credit default swaps, all of which could not be sold after they exposed their holders to massive losses where the amount owed on the mortgage was more than the value of the home - hence, toxic assets.
In a report released by RealtyTrac, a total of 1.53 million properties were in the foreclosure process in the first six months of the 2009. The "true" amount of toxic assets can be approximated by subtracting the value of the price the bank ultimately sells the home from the amount of the mortgage. The magnitude of this amount increases as the value of home prices declines.
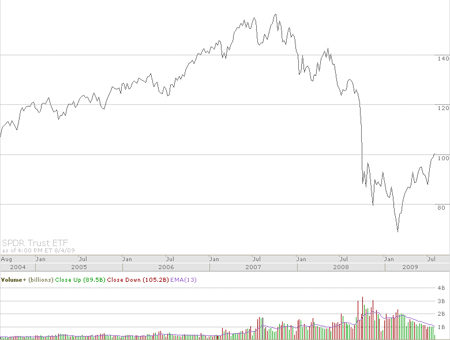
Figure 9: Plot of the S&P 500 Index from October 1, 2002 thru August 3, 2009.
The Recovery
Now that consumer spending appears to have stabilized at an anemic minimum level sufficient for day-to-day survival, we should now look to the future of the recovery. As a starting point we evaluate previous recoveries to see how long it has taken to regain full employment after levels of high unemployment. In Figure 10 presents the average unemployment rate for the civilian labor force 16 years and over. Unemployment peaked at 9.7 percent in 1982, and it took five years for unemployment to drop to 5.3 percent in 1989.
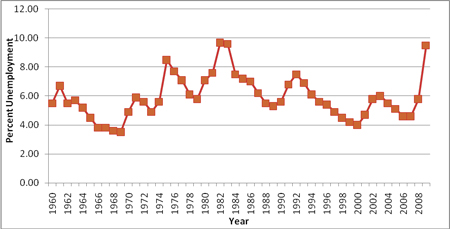
Figure 10: U.S. Unemployment rate since 1960 for the civilian labor force 16 years and older.
However, in the 1980s, residential real estate was fairly valued when measured against GDP, so in the next section we take a critical look at how long the recovery will take.
Estimating the Shape of the Economic Recovery Curve
Since one can do a reasonably good job in quantifying the economic growth associated with this run-up in artificial wealth in both the real estate and equity markets, one could also estimate he shape of the recovery curve by understanding the dynamics of how the economy will be re-built in the wake of the vacuum left by the evaporation of this artificial wealth.
As a starting point, given that approximately 70% of the GDP is consumer spending, the shape of the recovery could be estimated by plotting the recovery forecast for each of the IBD 197 O'Neil industry groups and then aggregating these together to arrive at a total GDP and total employment rate. This obviously would be highly data intensive. However, by making a few simplifications we could start to get a good estimate of the shape of the recovery curve. The simplifications made in this paper entail analyzing several disparate key industry segments and then using these findings as a rough approximation for the aggregate US economy .
To start with, we will look at the largest sectors, which include construction, technology, financial services, health services, retail and so on. Within the 197 Industry groups, there are several groups that are essentially sub-categories of the larger segments. For example, the Building Wood Products category is essentially a sub-set of the overall construction industry.
So, let's start with the construction sector. In the U.S. Although the housing boom is long gone, government spending on infrastructure could rejuvenate this sector over the next year to eighteen months. Without any aggressive construction subsidies, the U.S. could look to Japan's lost decade of the 1990s. In the late 1980s Japan's real estate values skyrocketed. However, this was a bubble - it had to be - at one time the value of Japan's real estate surpassed that of the U.S. and Japan's land mass is only about the size of California. Once Japan's real estate bubble burst, it took another ten years for their economy to recover. Thus, if we assume that all of President Obama's shovel-ready programs kick into high gear quickly, it will still be another 18 months at least for the construction industry to get back to full employment. That's a good start. But, now let's take a closer look at the fallout from the residential real estate market. With the fall in demand for goods came unemployment. Those without jobs obviously have limited ability to spend. According to the American Banker's Association, the number of HELOCs which are delinquent by 30 days or more rose from 1.89% in Q1 of 2008 to 3.52% in Q1 of 2009. In parallel, the number of real estate foreclosures is rising. The bulk of Americans who are fortunate enough to be gainfully employed have dramatically cut their discretionary spending. Looking back to Figure 3, we see that America's savings rate hit a new ten-year high of over 4 percent in the first quarter of 2009. In order to end this recession, Americans must start spending. This will put others back to work to support the demand.
Looking at U.S. manufacturing production, it will take several years to get back to pre-recessionary production levels after drops of 3% in 2008 and 12% this year. The contraction in this sector is considerably worse than the recessions of 1980-1982 and 1974-1975. Kiplinger's estimates that of the 2 million manufacturing jobs lost since Jan. 2008, only about two-thirds will return by 2013 (Pg. 1 The Kiplinger Letter, July 10, 2009). Orders for big ticket items such as aircraft and farm and construction equipment from overseas are also being impacted by the worldwide recession and will take at least a couple of years to improve.
Let's continue the analysis by evaluating the consumer electronics goods sector. Americans need disposable cash before they will buy new gadgets. So, this market will be the proverbial tail (of discretionary spending) wagged by the dog (income). A rise in disposable cash must be tied to a rise in employment. Therefore, we must focus on identifying sectors of the economy where jobs will be created.
Next, let's look at the financial services industry. A large number of jobs lost in the financial service sector have vanished permanently. Even under a best-case scenario it will take 2 ½ years for those in the financial services sector to get back to full-employment. However, even then, many will be making significantly less money than during the boom years. Case in point: Mortgage brokers and loan officers. Even 2 ½ years out, the average income of those re-employed in the financial services industry will average at best 70% of what they were making during the boom years. Real Estate, both residential and commercial, is another industry in which incomes will remain significantly lower than during the boom years
On the bright side, there will certainly be solid growth in the health care industry as more and more baby boomers reach retirement age. The growth in employment in this sector is already occurring. So, this sector will help to offset a small portion of the unemployment.
In the automotive sector, new car sales just now appear to be bottoming out. Americans are holding on to their older cars longer and will buy new cars now only as they need them. Many want to wait until GM and Chrysler re-tool and come out with fuel-efficient vehicles. So, it may take this industry takes another four to five years to get back to healthy growth.
Now consider another sector - start-ups. Alarmingly, the liquidity crisis has put a damper on funds available to Venture Capital firms, which fund entrepreneurial start-ups. These start-ups would typically be an excellent source of employment. Even if the government made available billions of dollars to VC firms today, it would take at least a year for funders to develop concepts for companies and to raise this money. A year after that they would be up and running and beyond that they could be able to experience good growth. However, Mark Andreessen, the multi-millionaire founder of Netscape, predicts that hundreds of VC firms will fail over the next several years. Therefore, unless the government figures out a way to funnel capital into VC firms or sets up its own VC firms, new venture initiation will severely stagnate for years to come. Currently, many of the VC firms are staying away from new venture initiation and are channeling their energies on growing companies that are already quite mature. So, again, to experience significant employment by start-ups, we would be looking at 5 years out unless there is a major change of government policy.
After consolidating the bottoming out and growth prospects for each sector of the economy, one can see that the recovery defined in terms of both employment and GDP will be slow and painful. These recovery curves are projected out to 2015 in Figure 7 below.
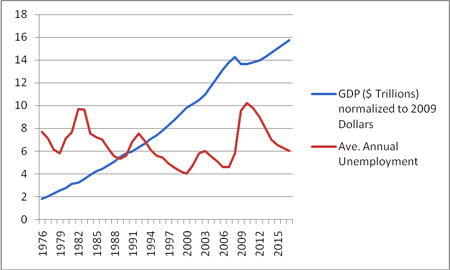
Figure11: Projections of the recovery curves for GDP and Employment through 2015.
These projections estimate that the GDP of $14.26T achieved in 2008 won't be achieved again on an inflation-adjusted basis until 2013. They also indicate that unemployment will slowly improve until it falls to 6.25% in 2016.
Conclusion and Suggestions that could speed the economic recovery
The problem with President Obama's approach to date is that he has been trying to fix the economic problems with a top-down approach. Obama has essentially continued the Bush - Paulson TARP approach, bailing out huge banks, insurance companies, brokerage houses and some major corporations. This approach is similar to President Reagan's "trickle down" economics that didn't work then and that is not working today. Implementing strategic "bottom-up" initiatives would directly address the problems at hand by creating more jobs and by putting more disposable cash in the hands of homeowners.
In this paper we propose two major bottom-up policy initiatives which would dramatically speed the recovery by focusing directly on benefiting millions of middle-class Americans as opposed to pumping billions of dollars of capital into large financial institutions and waiting for the trickle down benefits.
These programs are as follows:
i) In the short-term, Americans would have more ability to spend money if the Government would pass a bill that would give homeowners the opportunity to convert their current mortgages to interest-only for some duration of time, e.g. one, two, or three years. This could put several hundred dollars of disposable income back into the hands of consumers every month during the duration of the program. For example, for a $300,000 mortgage with a 5.5% interest rate, the total fully-amortized monthly payment would be $1,703 of which $328 is principal and $1,375 is interest in the first month. By allowing this borrower to pay interest only, the borrowers monthly payments would be reduced by $328 (or $3,396 per year) during the duration of the interest-only program. This would be a virtually no-cost government stimulus.
ii) The government could tremendously facilitate the creation of new jobs by participating in new venture initiation through matching investment in Venture Capital (VC) funded start-ups in the areas of high-technology, biotechnology, and alternative energy. There are many start-ups currently seeking to raise capital. They have interested investors, however, all they need is an entity to lead the round. If the government would take the lead on strategic investments, a multitude of companies would be created which would add wealth to America in the long term. These government investments would have huge long-term benefit to the U.S. as a whole and they would promote keeping the U.S. at the competitive forefront of the world.
A comprehensive and cohesive solution to the current economic crisis could be implemented by expanding the above recommendations to include the following: 1) Expanding student loan programs which would lead to a higher-skilled labor pool, 2) Augmenting unemployment insurance to include an option for individuals to borrow, 3) Augmenting health insurance by enabling a larger percentage of citizens to qualify at reasonable rates (e.g. much below the current HIPAA rates which keep escalating) , and 4) Greater support for small and medium size businesses that are the engines of employment, investment, and growth for the economy.
The implementation of these program would form a solid foundation upon which the U.S. could re-build its economy and ensure a sustainable economic future for the country. If the first two programs above are initiated aggressively, the economic recovery will accelerate. Otherwise, we are in for a long and painful recovery.
R. Kyle Martin held numerous executive level positions in the U.S. and Japan in the high- technology sector prior to focusing full-time on finance and economics. He is an accredited investor with a focus on high-technology stocks and real estate. His returns consistently meet or exceed those of the world's top analysts. He may be reached at kylemartinusa@att.net.
Michael D. Intriligator, Professor of Economics, Political Science, and Public Policy, UCLA and Senior Fellow, the Milken Institute.