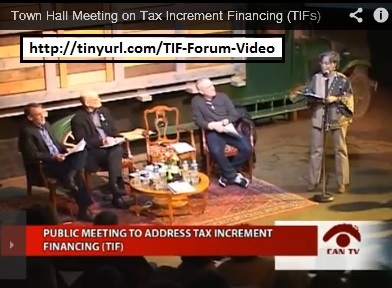
On February 12 of 2013, the night of the State of the Union, a town meeting was held at the Chopin Theater in Chicago's Near West Side. The subject was tax increment financing. Despite the complexity of the topic and the competition from President Obama, some 230 people packed the theater to hear a journalist, an academic and an activist discuss TIFS.
The TIF Town Meeting was the launch of the CivicLab's TIF Illumination Project.
The Tax Increment Financing (TIF) Illumination Project is an effort of a group of volunteers in Chicago to investigate and expose a decades-old municipal finance scheme that annually extracts almost 500 million dollars of local property taxes and places that money in a program controlled by the mayor. This program has dispensed billions of property tax dollars to major U.S. companies (Wal-mart, Target, Home Depot, UPS, Coca-Cola, United Airlines, Willis Insurance) to well-heeled developers of Loop office towers and to a collection of connected developers throughout the city.
This program has been a source of controversy here for years but is not readily understood by Chicagoans. It is decidedly not a public process and the rationale behind what projects are selected for subsidy in the name of "community development" is not apparent or available for any community to debate or participate in. Chicago has a notoriously corrupt and opaque government with numerous local councilmen having been sent to prison. The city was ruled with an iron hand for 43 years by the father and son Daleys, and the Democratic Machine had a firm lock on local government for almost one hundred years. This is a tough town for civic engagement, government transparency and grassroots urban policy planning.
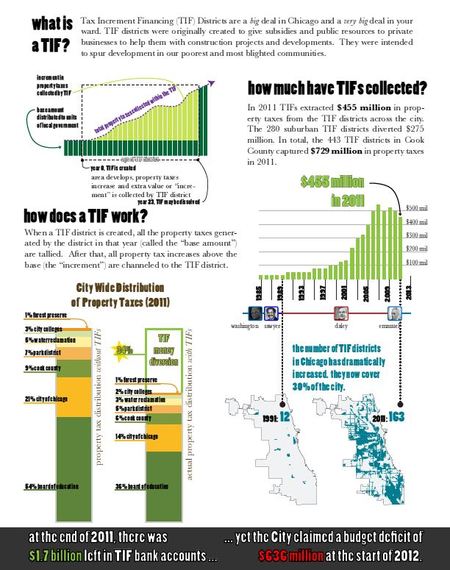
 A Tax Increment Finance district is created by the City's Department of Planning and Development. It is a tool to capture property taxes from all properties inside the district. A TIF is usually created to build some project in a "blighted" community that the free market won't support. The developer seeks a gift of cash and/or land to do their project because it is deemed to be a public good. A snapshot is taken of the value of the properties inside the district and how much property taxes they are paying. The TIF district captures all INCREMENT from all those properties for 23 years. The money captured by the TIF is effectively "off the books" from the annual public budgeting process.
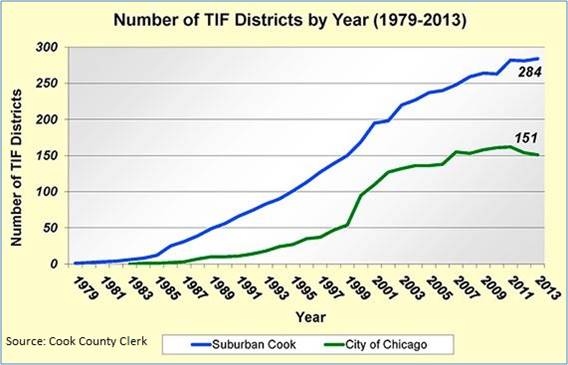
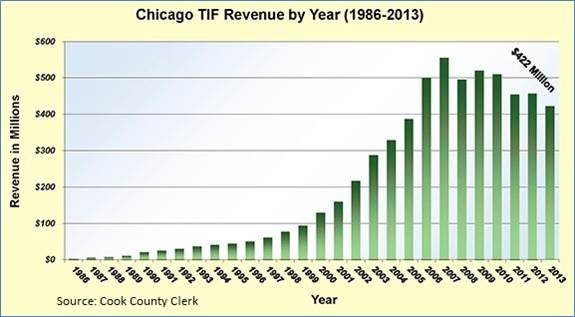
Since TIFs first appeared in Chicago in 1986 they have captured over $6 billion in property taxes.
The TIF Program has taken on significant political and civic import because it diverts and disperses property taxes. In Chicago about 54 cents of every property tax dollar collected by the city is supposed to go to the Board of Education. Other units of government that rely on property taxes for significant parts of their budget include the public libraries, the public parks, the city colleges, the county government and the city, itself. So any entity that steps in and skims, so to speak, hundreds of millions of property tax dollars annually is a grave threat to the finances of local government. Currently Chicago has 154 TIF districts covering about 32 percent of the city. No other city in America has so many special taxing bodies.
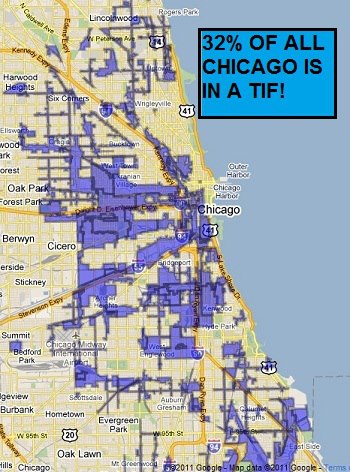 About 32% of Chicago is in a TIF district!
The TIF Illumination Project is an exercise in civic imagination. It's about civic geography and civic mental map-mapping. We set out to answer the question of "What are TIFs doing to MY community?" If you ask a person, "How is life in the Kinzie Industrial TIF?" they will look at you blankly. But if you ask, "How is life in the 27th Ward?" then people can locate themselves and form a response based on their lived experience of that community. We are telling people what TIFs are doing to us a ward-by-ward basis.
Our volunteers have acquired eight different sets of data and using data mining, GIS coding, map making, investigatory journalism and crowd-sourced organizing, we have compiled an unprecedented picture of what TIFs are doing across the city.
 We can tell you, on a ward-by-ward basis:
- How many TIFs are in the ward
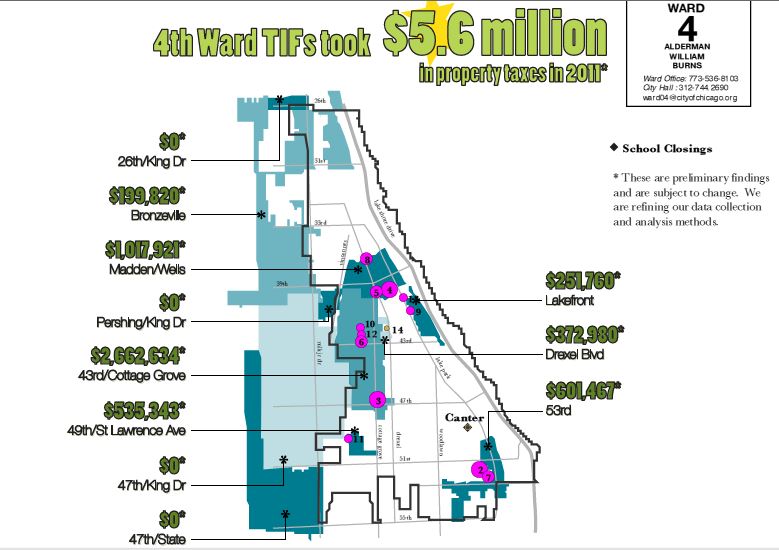
- How much money they extracted from within the ward last year
- How much money was left in the TIF accounts at the start of this year
- What projects were funded by TIFs inside the ward
- How much money was transferred IN or OUT of the TIFs
- How much money the Department of Planning and Development skimmed from those TIFs (in 2013 it was a total of7.6 million from ALL the TIFs)
- Location of public schools that have closed by the Board of Education
- Location of public schools that have received budget cuts for the current year
We produce a graphic poster showing all this against a map of the ward we are covering plus a general piece that explains what TIFs are. We do a 50-minute presentation that walks through the history and scope of the TIF program and then zooms in to reveal the details of the TIFs in the ward we are visiting.
At the TIF Town Meeting at the Chopin Theater on February 12, 2013, we asked the attendees if they found the information useful. There was a strong response from the audience that this information was a revelation. We then invited folks to return to their communities and organized public meetings -- or Illuminations -- as we call them.
People responded with enthusiasm. The first meeting was in the 6th Ward on March 9 and since then we've been to 31 meetings and have Illuminated 139 TIFs across 31 wards! Over 4,200 people have attended these meetings. All the presentations are available at our TIF Data Store.
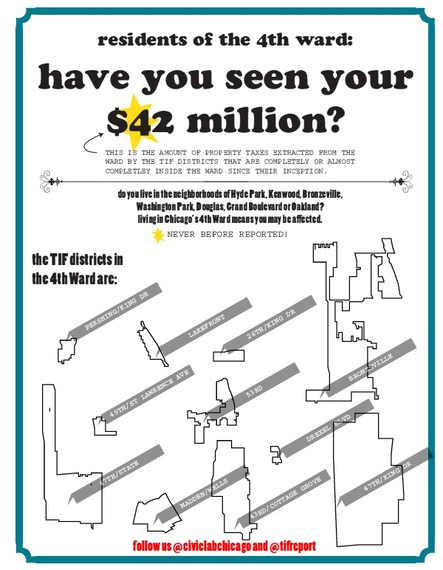
Here is the graphic produced for the TIF Illumination of the 4th Ward (Hyde Park, home of the University of Chicago and President Obama) we did on May 13, 2013.
The piece is designed for ledger size, two-sided, full color. The fold is along the left. The front follows this pattern, with a call out to the residents of the ward we are visiting. We identify the major named neighborhoods inside the ward and produce the TIF district shapes as though they are the culprits on a wanted poster. The headline is derived from looking at one or more TIFs that are entirely inside or mostly inside the ward.
 The back of the piece remains the same across all our Illuminations and will be updated for meetings in 2014 to incorporate the latest data. We endeavor to explain what TIFs are using text and graphics.
The piece was produced by Tom Tresser, designed by Carlyn So and based on the data research of Cory Mollet and Bill Drew. There are many others who helped and some would prefer to keep their participation private.
Our first poster went through seven iterations and was reviewed by one of America's most experienced academics in the TIF and local government finance arena. We are constantly testing this work. Is this the best way to explain TIFs? We've translated this part of the poster into Spanish and are working to turn the poster into a comic book and animation.
 This section is immediately below the map and contains the final exclusive piece of news that the TIF Illumination Project delivers to communities. We use the same data analysis that got us the basic Illumination to determine how much money was left in the TIF accounts from the in-ward TIFs at the start of the year.
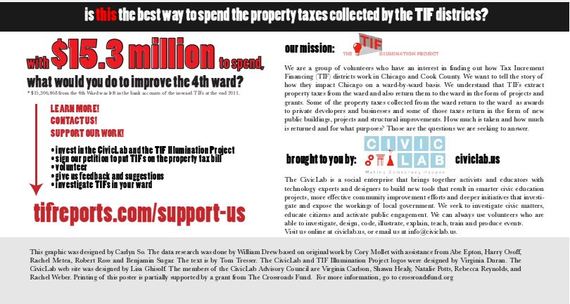
This number is shown in red and asks the provocative question: "What would you do to improve the ward" if you had this money available? In the case of the 4th Ward at the start of 2012, that number was $15.3 million.
The remainder of this section of the graphic explains what the TIF Illumination Project is about and also explains that it is a project of the CivicLab, a new co-working space in the West Loop dedicated to collaboration, education and innovation around civic engagement.
We have shown folks who has gotten paid via TIFs and revealed details hitherto kept secret -- including the startling fact that the TIF accounts held $1.7 billion on January 1, 2014.
This information challenges the notion that we are broke.
The net result is that people ask more questions than can be answered. They are angry. They wonder if the city is truly broke, as the mayor claims. They want to know who green-lighted the projects that received so much public dollars and why are essential city services being cut (including the closing of 49 public schools) at the same time?
We launched an online petition to put TIF data on the property tax bills that the county issues twice a year, and beginning in July of 2014, that will happen.
We launched a second online petition demanding that the mayor account for the $1.7 billion and release those funds to the units of government that SHOULD'VE gotten those funds in the first place. Over 3,700 people have signed so far. In an August 2, 2013 editorial headlined "Hand Over TIF Surplus Cast To Chicago Schools," the Chicago Sun-Times agreed with us!
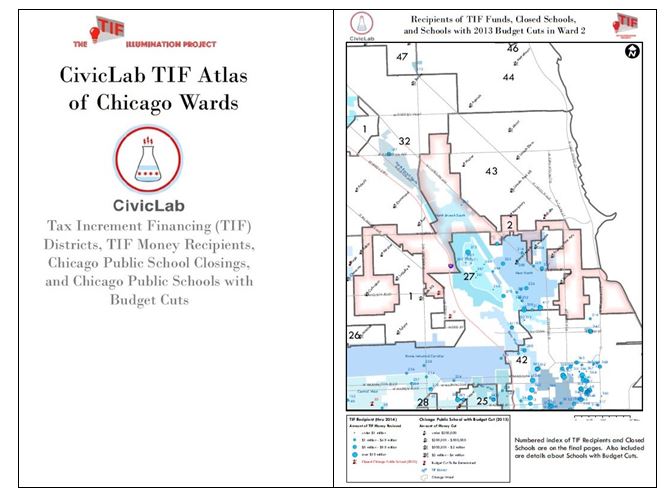
We have placed all our presentations online for easy access and purchase at the TIF Data Store. You can also purchase a copy of our TIF Atlas that shows ALL the TIFs in the new ward maps PLUS locations and details of all TIF funded projects up through 2010 and much more!
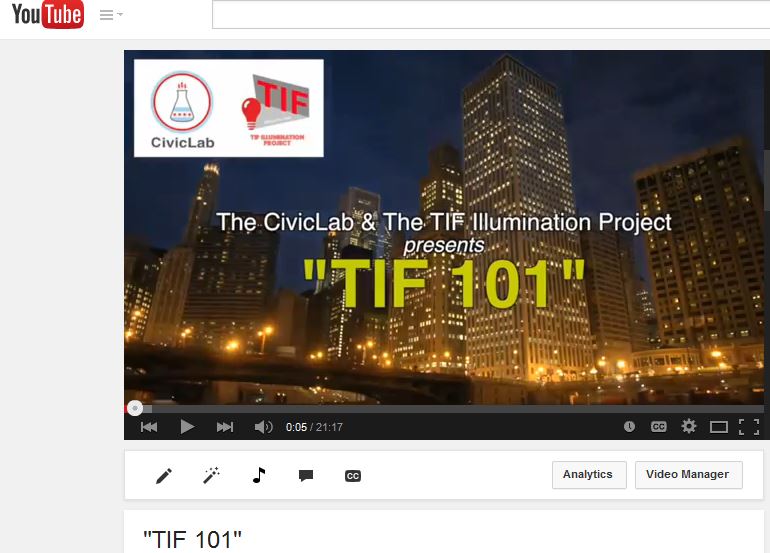
In October of 2014 we launched our first crowdfunding campaign to raise funds to produce a TIF training video so we could Illuminate more people more efficiently. 80 donors gave over $3,300 and the 20 minute "TIF 101" video is now available for your viewing pleasure. Please do get Illuminated.
Our thanks to Professor Rachel Weber of the University of Illinois and Cook County Clerk David Orr for appearing in the video to share their knowledge and perspectives on Tax Increment Financing.
Now we are raising funds to produce our second video, "The TIF Hall of Shame," which will document the problems and scandals inside Chicago's TIF program. We hope to produce a total of five videos. Next up will be "TIFs and Schools," "Organizing Around TIFs," and "Alternatives to TIFs for Grassroots Community Development."
We are delighted that our Illuminations have shed new light on a major piece of Chicago's financial infrastructure and that our work is impacting public policy. Over 75 stories have been written on our work.
Candidates for mayor and alderman have worked with us to articulate their positions on TIFs and seven TIF Illuminations have been sponsored by candidates running for alderman.
An article in the Chicago Sun-Times and an editorial in the Chicago Tribune referenced $1.7 billion in TIF funds. The only way that the editors at the Chicago Tribune (as well as the rest of the public) knew that there was $1.7 billion sitting in TIF accounts was because the volunteers of the TIF Illumination Project has been opening up all the annual reports from the TIF districts when they are released in July and manually adding up the balances! We've been doing that since 2009 (although the TIF Illumination Project formally launched in February of 2013, this work has been going on for quite a while). See our analysis for all of Chicago's TIFs for 2013 at our TIF Reports web site.
We are thrilled to see civic indignation evolve into civic imagination as our neighbors are now looking past the corrupt and broken TIF Program toward some new ways of imagining local economic development. We will report on these developments in 2015.
More information on the TIF Illumination Project, including all public presentations made to date, is online at http://www.tifreports.com. All our presentations, as well as our 50 Ward TIF Atlas can be purchased at our TIF Data Store.
More information on the CivicLab and our co-working program is at http://www.civiclab.us. If you'd like to bring the TIF Illumination Project to YOUR community, please reach out to info@civiclab.us.