
Perceptual mapping is a technique that allows you to visualize the positioning of different brands in the market. Using perceptual maps, you can quickly compare yourself to competitors and make strategic decisions about whether or not you need to reposition your brand.
There are a several ways to create a perceptual map. I'd like to look at two extreme approaches -- the easy way and the hard way.
Method One: The Easy Way
Perceptual maps are based on how consumers view brand personalities, but this method doesn't require any new market research. Instead, it's simply a way to visualize and refine your current understanding of your market.
You can make a perceptual map for any competing set of products. For this example, I considered comparing different brands of cars or laundry detergent, but I thought it would be more fun to try something off the beaten path. With that in mind, here's how to make a perceptual map of famous cinematic anti-heroes.
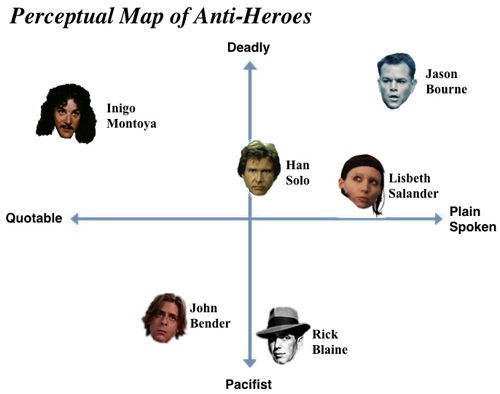
Step One: Pick the leading brands in your market. You can include as many relevant competitors as you want, but to keep it simple (you'll see why when we look at the hard way below) I'm just picking six popular movie characters:
• Han Solo (the original Star Wars trilogy)
• Inigo Montoya (The Princess Bride)
• John Bender (The Breakfast Club)
• Lisbeth Salander (The Girl With the Dragon Tattoo)
• Jason Bourne (The Bourne Identity/Supremacy/Ultimatum)
• Rick Blaine (Casablanca)
Step Two: Pick the two most relevant criteria to compare the brands. I've chosen to look at how deadly and how quotable they are.
Step Three: Draw a simple matrix with one criterion mapped to the vertical axis and the other mapped to the horizontal axis. Position the brands accordingly.
Simply going through this exercise gives you a new perspective and forces you to answer questions you might not normally consider. The downside to the easy method is that there's no data to back any of it up. I'm sure some of you are probably questioning how I thought the characters are positioned. (Please feel free to tell me how wrong I am about Han Solo in the comments section.) To overcome this shortcoming, it makes sense to tackle perceptual maps by committee.
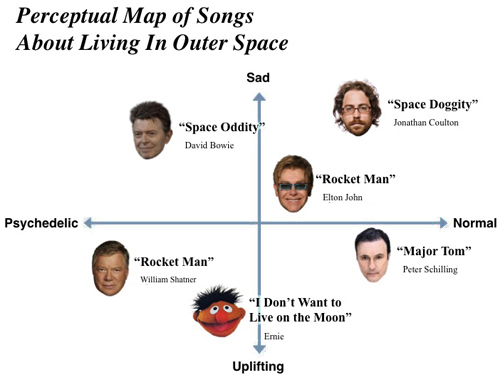
Here's one more map that compares songs about living in outer space in terms of how psychedelic and sad they are.
Wasn't that more fun than comparing detergent brands? I hope so, because we're about to take a look at...
Method Two: The Hard Way
Most of the times you see a perceptual map in a PowerPoint deck or report, it was generated the easy way. The hard way is built around data gathered through market research. The questionnaires are very difficult for people to complete for the following reasons:
1. There are an unusually high number of questions.
2. The questions are hard to answer.
Suppose we're looking at the auto industry. If you simply wanted to determine if customers prefer the Volkswagen Beetle to the Mini Coop, you could find the answer in two questions (rating each brand independently.)
If, on the other hand, you wanted to map perceptions on two different axis for multiple car brands, you have to ask people how similar every possible pairing of cars is. Let's revisit the anti-heroes example from above. We're only mapping 6 things, but the questionnaire would require 15 questions. Here's what it would look like to somebody filling out the survey:

Again, that's just for 6 positions to map. If you wanted to map 12 brands of soap, you'd need 66 questions. If you wanted to map 20 car brands, you'd have to ask 190 questions. This type of questioning takes a lot of time for respondents. The deeper they get into the survey, the less concerned they'll be with providing accurate answers.
These are also hard questions to answer because they're open ended and abstract. On a scale of 1 to 7, how similar are Han Solo and John Bender? If you were answering that, what criteria would you use? The respondents might want to say they're similar in that they both flaunt authority, but on the other hand... one of them is in high school and the other flies a space ship. As it gets more frustrating and confusing for people, they're likely to be less accurate.
If you do manage to incentivize people to invest the time to completely and accurately fill out your questionnaire, you still have to process your data. You'll need to run your results through statistical analysis software like SPSS. Once you have that, you can generate a data-driven perceptual map... but without any labels for the four quadrants.
Theses unlabeled maps will show you that Brand X and Brand Y are very similar or that Brand Z has no close competitors in the lower right quadrant, but they won't tell you what the axes mean. Does the vertical axis represent the perceived quality of the product? Durability? Easy of use? Environmental friendliness? It's up to you to determine that.
If you're going to be relying heavily on perceptual mapping to reposition a brand, this is the ideal method. For anything that's simply a leaping off point for other discussions, go the easy way.