
Happy New Year! Or as those who are celebrating Rosh Hashanah say, "shana tovah u'metukah" (a good and sweet new year).
People who are engaged in the political debate over global warming have established the New Year's tradition of speculating on whether a new annual record has been set, and then arguing about arcane and irrelevant details.
Every January, various data sets are compiled and released by scientists. Journalists dutifully report and dissect the records and rankings of previous years as if they were NFL playoff scores. In January 16, NASA announced its analysis of global thermometer measurements revealing that 2014 was the hottest year in modern history. NOAA, the scientific agency that operates the National Weather Service and the National Hurricane Center independently came to the same conclusion.
Deniers and conspiracy theorists immediately accused NASA and NOAA of lying, an extraordinary claim that any true skeptic would challenge. The Heartland Institute, a pressure group that defends carbon polluting industries, appealed to "margin of error" on their blog. It dismissed the record, saying that seven previous years "are all within nine one-hundredths of a degree of 2014's level" (apparently attempting to make it sound smaller by neglecting to point out the unit of measure was not the Fahrenheit degree familiar to Americans).
The data set favored by deniers is not based on thermometers, but on indirect satellite-based microwave measurements that are converted to a temperature index using various models and empirical corrections that can give different answers depending on assumptions. This index is related to a weighted global average temperature of the lower troposphere. In the carefully-parsed words of Roy Spencer, "2014 was third warmest year since 1979, but just barely." Like the Heartland Institute, he focused on the small margin and argued that it was effectively a tie.
What does Rosh Hashanah have to do with this discussion?
Scientists have a concept that we describe with the word "robust." A robust result or conclusion is one that is independent of arbitrary assumptions or choices. From a scientific perspective, the date that a year begins is entirely arbitrary. Rosh Hashanah, the start of the civil year, is in fact only one of four Jewish new years and is defined by the Old Testament. Science deniers of all stripes should approve, since the year's number is defined as the age of the Earth according to the Bible (with year 5775 certain to set another temperature record that I could calculate if NASA used the calendar months prescribed in Leviticus).
The New Year's date we use to start our modern calendar year is no less arbitrary and was defined by Pope Gregory XIII in 1582 (but Orthodox Christians still use the older Julian calendar for religious holidays). We also have various fiscal years, tax years, and academic years. Even NASA uses two different years to calculate annual average: the normal calendar year and one running from Dec. 1 through Nov. 30.
Are single-year temperature averages scientifically robust enough to warrant the annual hand-wringing of reporters, bloggers, and deniers over heat records and rank order? It is easy to answer this question by running what scientists call a sensitivity test. Use the same exact data but with different arbitrary choices. So I did.
Just to illustrate the effect, I chose NASA's land surface temperature (based on weather-station thermometers). This is the temperature that directly affects people, because we all live on land, and I used Fahrenheit because I live in the USA.
For my first graph, I used monthly data to calculate the calendar-year average temperatures, just like NASA does. What I show is the amount of warming since the average global temperature between 1951 and 1980, the period that the National Weather Service considered to be normal in 1988. That happens to be the year that the Intergovernmental Panel on Climate Change (IPCC) was created and in which NASA scientist James Hansen warned Congress about global warming. The weather service has since redefined "normal" (it's now warmer, as Hansen and others predicted). So I like to call this the "pre-IPCC normal" to put the warming in perspective.
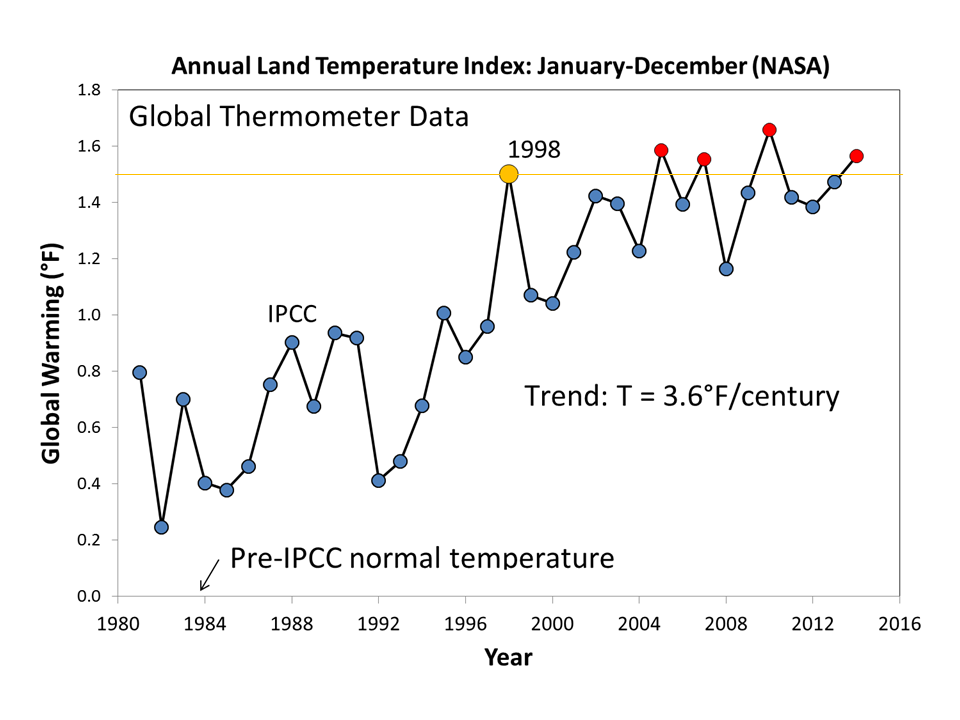
This claim of a pause or "hiatus" in global warming has been refuted by scientists and skeptics time and again, but one of the most widely used talking points by deniers is that "it hasn't warmed since 1998" (now apparently updated to "it hasn't warmed by more than the margin of error"). Nineteen ninety-eight was a particularly hot year during its decade, but the same temperature is now normal, with four years out of the last ten exceeding it. The objective (mathematically-defined) long term trend over a period centered on 1998 is still obviously upward at 3.6 degrees per century. Only a fool would bet that climatological temperature won't continue to rise (and notably, the Heartland Institute did not accept such a challenge by skeptics despite what their bloggers claim to believe).
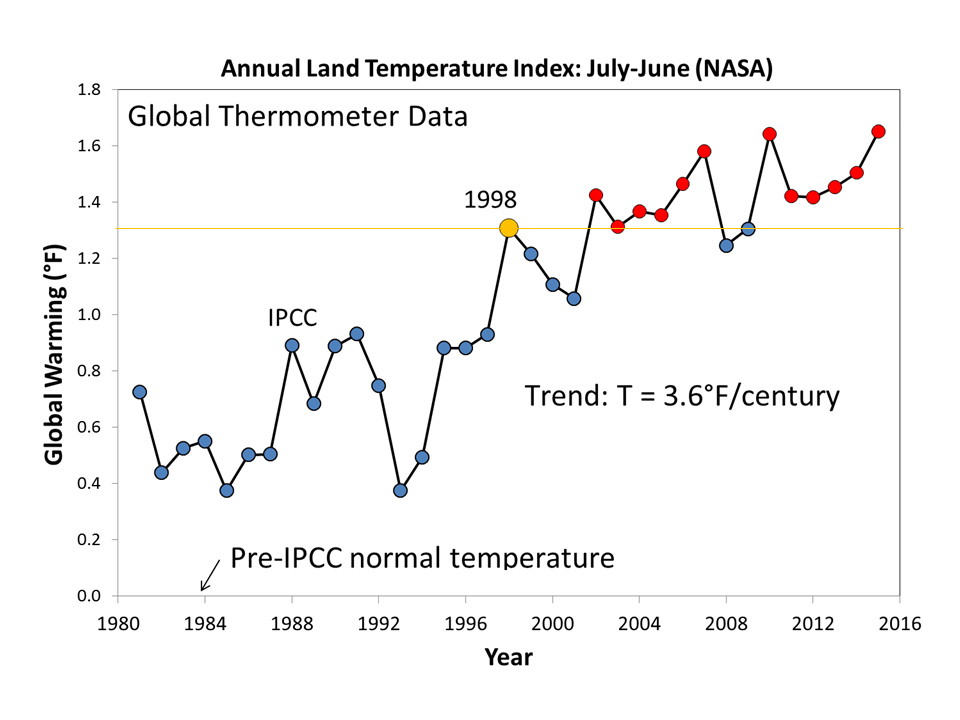
My second graph shows the same data, but using July-June "fiscal year" (and like a fiscal year, I call the one that just ended "2015" even though it started in the middle of calendar 2014). What a difference! 1998 was still the hottest year of its decade, but was rapidly superseded by a long series of even hotter years: 12 out of the last 14! If a different arbitrary new year's date had been used, deniers would never have been able to make the "global warming stopped in 1998" argument at all. But the long-term trend, calculated rigorously as before, is exactly the same.
Just for fun, I also created a bar chart showing the number of years since 1998 that have been warmer, using 12 different starting months to define the relevant year.
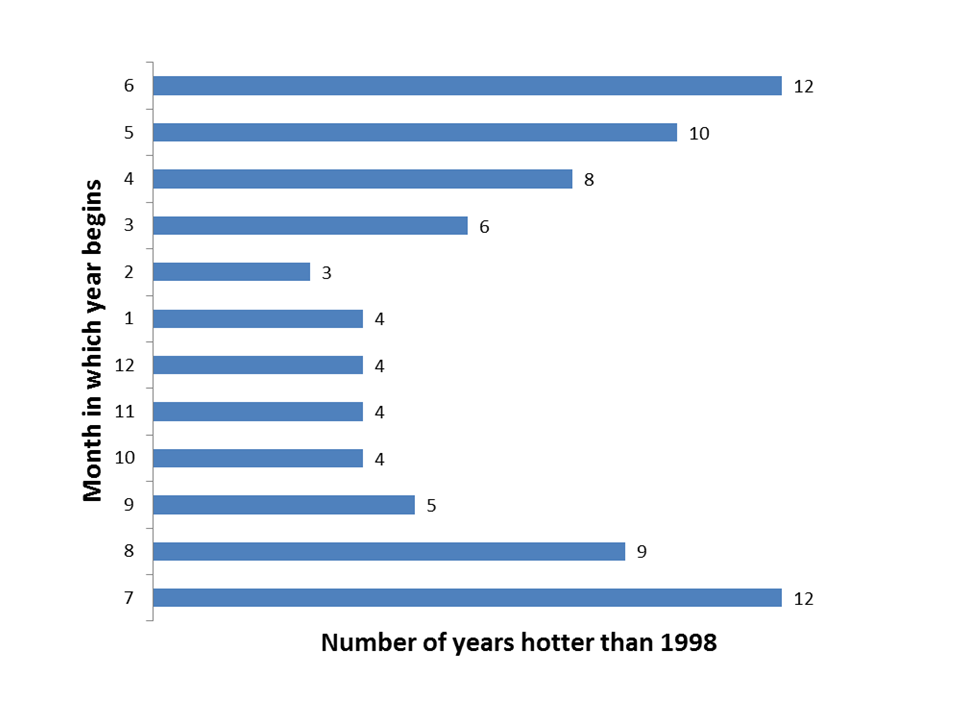
In geek-speak, the records and rankings that are endlessly discussed on opinion pages and cable TV are not robust to arbitrary decisions, but the long term trend is. Perhaps reporters and bloggers should stop making a big fuss out of meaningless statistics and focus on what really matters: the trend.
Shana tovah u'metukah.